Unit 6 · 6 teaching hours · 17 min read
Intrusion Detection, Alert Statistics, Incident Response and Digital Forensics
What the syllabus asks for 7
- Detection systems
- The confusion matrix
- The base-rate fallacy
- Incident response lifecycle
- Digital forensics
- Seeing the ideas: forensic hardware, sensor placement, the confusion matrix, the incident cycle and the custody chain
- Summary and exercises
Prevention fails sometimes, so security teams also detect and respond. A security operations centre receives thousands of alerts a day from sensors that watch networks and hosts, and its analysts must decide which few deserve attention.
The statistics of detection are deeply counter-intuitive: a detector that is right 99 times out of 100 can still be wrong most of the time when it raises an alarm.
Once an incident is confirmed, a disciplined response lifecycle and careful evidence handling decide whether the organisation recovers cleanly and can prove what happened.
- IDS, IPS and SIEM: types, placement and detection methods.
- The confusion matrix: TPR, FPR, precision, accuracy and F1.
- The base-rate fallacy, shown by Bayes' rule and by numbers, and what it means for alert design.
- The incident response lifecycle, and digital forensics with SHA-256 hashing and a tamper-evident chain of custody.
6.1 Detection systems
An intrusion detection system (IDS) watches activity and raises alerts; an intrusion prevention system (IPS) sits inline and can also block.
A network IDS inspects traffic at a tap or mirror port; a host IDS (and modern endpoint detection and response, EDR) inspects processes, files, logs and system calls on a machine.
A SIEM (security information and event management) collects logs from all sources, normalises and correlates them and presents alerts and dashboards.
Detection methods:
- Signature-based: compare activity with patterns of known-bad behaviour. Accurate for known issues and silent on new ones.
- Anomaly-based: learn a baseline of normal behaviour and flag deviations. It can catch novel activity but produces more false alarms.
- Stateful and behavioural rules: for example, many failed logins followed by a success from one address, or an administrator account used at an unusual hour.
Placement matters: sensors at network boundaries, between internal zones (to see lateral movement) and on critical hosts; and their data must be protected and time-synchronised so that events from different sources can be ordered.
6.2 The confusion matrix
Every alert decision falls into one of four cells:
| Actually malicious | Actually benign | |
|---|---|---|
| Alert raised | True positive (TP) | False positive (FP) |
| No alert | False negative (FN) | True negative (TN) |
Derived measures:
- True positive rate (TPR, recall, sensitivity) = TP ÷ (TP + FN): the share of real attacks detected.
- False positive rate (FPR) = FP ÷ (FP + TN): the share of benign events wrongly flagged.
- Precision (positive predictive value) = TP ÷ (TP + FP): the share of alerts that are real.
- Accuracy = (TP + TN) ÷ total, and F1 = 2TP ÷ (2TP + FP + FN), the harmonic mean of precision and recall.
6.3 The base-rate fallacy
Suppose a detector has TPR 99% and FPR 1%, which sounds excellent. Monitor 100,000 events of which only 100 are malicious (a prevalence of 0.1%, realistic for security data). By Bayes' rule, the probability that an alert is real is
P(malicious | alert) = TPR × p ÷ (TPR × p + FPR × (1 − p)), where p is the prevalence of malicious events.
total, malicious = 100000, 100
tpr, fpr = 0.99, 0.01
tp = round(malicious * tpr)
fn = malicious - tp
fp = round((total - malicious) * fpr)
tn = total - malicious - fp
precision = tp / (tp + fp)
accuracy = (tp + tn) / total
f1 = 2 * tp / (2 * tp + fp + fn)
print(f"events {total}, malicious {malicious}: TP={tp} FN={fn} FP={fp} TN={tn}")
print(f"TPR {tp / (tp + fn) * 100:.2f}%, FPR {fp / (fp + tn) * 100:.2f}%, precision {precision * 100:.2f}%, accuracy {accuracy * 100:.2f}%, F1 {f1:.4f}")
prev = malicious / total
bayes = tpr * prev / (tpr * prev + fpr * (1 - prev))
print(f"P(malicious | alert) via Bayes: {bayes * 100:.2f}%")
events 100000, malicious 100: TP=99 FN=1 FP=999 TN=98901
TPR 99.00%, FPR 1.00%, precision 9.02%, accuracy 99.00%, F1 0.1653
P(malicious | alert) via Bayes: 9.02%
The detector finds 99 of the 100 real events but also raises 999 false alarms on benign traffic, so only 9.02% of alerts are real.
Accuracy is 99%, a number that is nearly meaningless here: a "detector" that never alerts would also score 99.9%. The Bayes calculation gives the same 9.02% as the counted precision, confirming that the arithmetic is consistent.
The lesson is that a low base rate can drown a good detector in false positives, so judge detectors by precision and recall at the real prevalence, not by accuracy.
How strongly does the false-positive rate matter? And what does it cost in analyst time? The next program varies FPR and converts alerts to hours at an assumed 5 minutes per alert.
total, malicious, tp = 100000, 100, 99
benign = total - malicious
p1 = tp / (tp + benign * 0.001)
p2 = tp / (tp + benign * 0.0001)
print(f"precision at FPR 0.10%: {p1 * 100:.2f}%; at FPR 0.01%: {p2 * 100:.2f}%")
alerts = tp + round(benign * 0.01)
print(f"daily alerts {alerts}, analyst effort {alerts * 5 / 60:.1f} hours at 5 min each")
precision at FPR 0.10%: 49.77%; at FPR 0.01%: 90.83%
daily alerts 1098, analyst effort 91.5 hours at 5 min each
Cutting FPR tenfold to 0.1% lifts precision to 49.77%, and to 0.01% lifts it to 90.83%.
At the original 1% FPR the team gets 1,098 alerts a day, about 91.5 analyst-hours of triage: more than a whole shift of several people, which is how alert fatigue sets in and real alerts get ignored.
Practical remedies are tuning rules to your environment, raising alerts on correlated evidence (several weak signals together) rather than each one, risk-based alerting that weights by asset value, allow-listing known-good activity, and automating routine triage with playbooks (SOAR).
6.4 Incident response lifecycle
An incident is an event that actually or potentially jeopardises confidentiality, integrity or availability. NIST SP 800-61 describes a lifecycle with four phases (a newer revision re-expresses them using the NIST Cybersecurity Framework functions):
- Preparation: a written plan and policy, a trained response team with roles and contacts, tooling (logging, forensic kits, backups), communication templates and regular exercises (tabletops).
- Detection and analysis: identify and validate the incident, determine scope and severity, preserve evidence, and decide who must be told.
- Containment, eradication and recovery: limit the spread (isolate hosts, disable accounts) while balancing evidence and business needs; remove the cause (patch, rebuild, rotate credentials); restore from clean backups and monitor closely.
- Post-incident activity: a blameless review within days, lessons learned, updated controls and metrics such as time to detect and time to recover.
Report incidents as the law, contracts and sector regulators require.
In Nepal that can involve the Nepal Police Cyber Bureau for criminal matters, the national CERT for technical coordination and the sector regulator (for banks, Nepal Rastra Bank). Legal context is covered in Unit 7.
6.5 Digital forensics
Digital forensics collects, preserves, analyses and presents electronic evidence so that it stands up to scrutiny.
Core principles: do not alter the original; work on verified copies; document every step; and keep a clear chain of custody.
Collect evidence in order of volatility (RFC 3227): CPU registers and cache, memory, network state and running processes, then disk, remote logs and archival media.
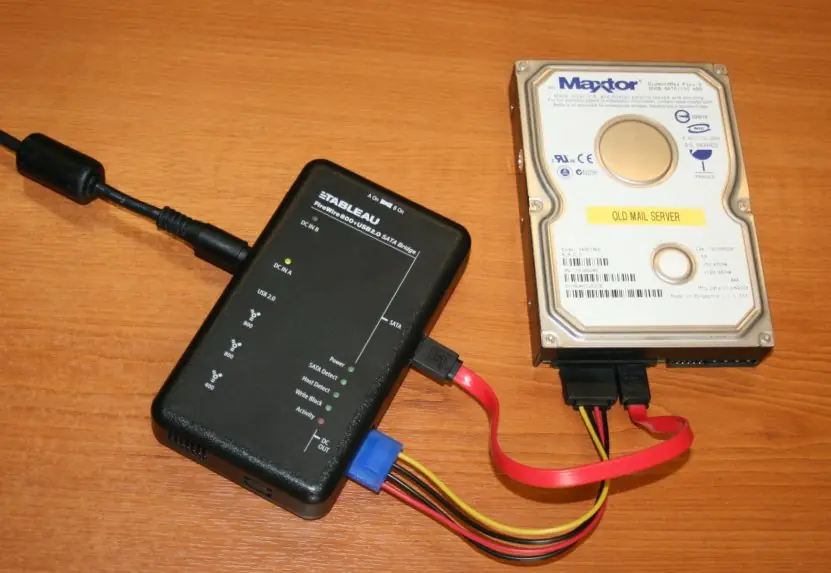
Use write blockers when imaging a drive, and record the make, serial number, time and person.
The key tool is the cryptographic hash. A SHA-256 digest of the evidence image, taken at acquisition and recomputed later, proves it has not changed: any single-bit change gives a completely different digest.
A chain-of-custody log records each handover (who, what, when). To make the log itself tamper-evident, each entry can include the hash of the previous entry, forming a hash chain: altering any earlier record changes every later hash.
import hashlib

def h(b):
    return hashlib.sha256(b).hexdigest()

evidence = b"disk-image-bytes-0001"
ev_hash = h(evidence)
print(f"evidence SHA-256 (first 16 hex): {ev_hash[:16]}")

log = [("Officer Rai", "seized laptop"), ("Lab tech Karki", "imaged disk"), ("Analyst Thapa", "analysis copy")]

def build(entries):
    prev, chain = "0" * 64, []
    for who, act in entries:
        cur = h((prev + who + "|" + act + "|" + ev_hash).encode())
        chain.append(cur)
        prev = cur
    return chain

stored = build(log)
def verify(entries):
    return build(entries) == stored

print(f"custody chain entries: {len(stored)}, verified: {verify(log)}")
edited = list(log)
edited[1] = ("Lab tech Karki", "imaged disk (note edited)")
print(f"after editing entry 2: verified {verify(edited)}")
evidence SHA-256 (first 16 hex): e756a790143143e7
custody chain entries: 3, verified: True
after editing entry 2: verified False
The evidence digest was independently recomputed with the sha256sum utility during checking. The untouched log verifies, and editing even one note in entry 2 makes verification fail, so the change is detected.
Real practice adds signed forms, trusted timestamps and secure storage of the stored chain; the hash chain is the core idea behind tamper-evident logs, including the audit logs that the Cloud Computing course (Unit 6) recommends sending to a separate, write-protected account.
Hashing proves that evidence has not changed since it was hashed, not that it was handled correctly before that moment. Hash at the earliest possible point, and never run analysis tools on the original.
6.6 Seeing the ideas: forensic hardware, sensor placement, the confusion matrix, the incident cycle and the custody chain
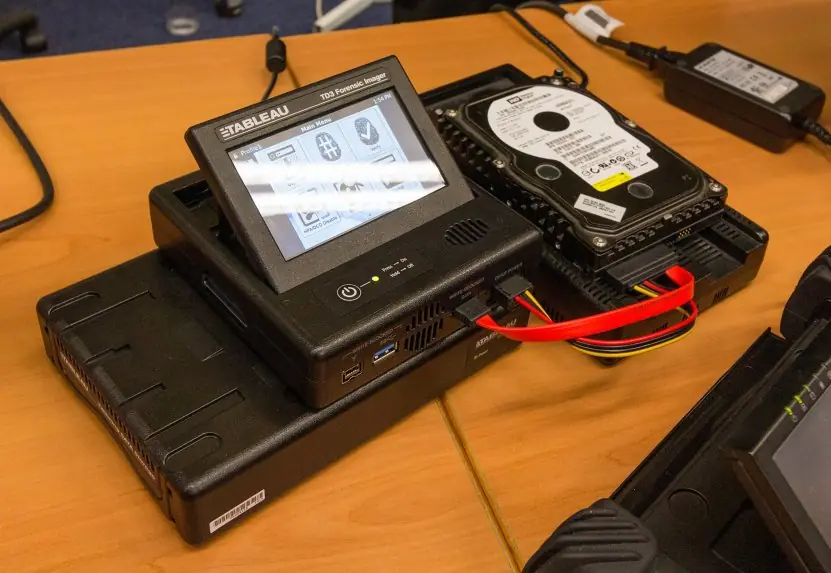
Digital forensics begins with hardware that protects evidence. Plate 6.1 shows two devices used by examiners: a write blocker that lets a disk be read but never written, and a stand-alone disk imager that makes the exact copy that analysis will use.


6.6.1 Eight good practices for incident response and forensics
- Prepare before anything happens. Write an incident plan, name an owner and keep contact numbers current. A hospital should know in advance who calls the IT head and who calls the police. Practice with a table-top exercise twice a year.
- Collect and protect logs. Send logs to a central, protected server with synchronised clocks. Attackers often delete local logs first. A central copy lets the team rebuild the timeline.
- Triage by impact. Rank alerts by the value of the asset and the severity of the event. Analysts cannot read 1,098 alerts a day. Start with alerts on payment, identity and database systems.
- Contain first, then investigate. Isolate the infected machine from the network but keep it powered if memory evidence is needed. Cutting the network stops spread. Wiping too early destroys evidence.
- Preserve evidence. Use a write blocker, make a bit-for-bit image and record its SHA-256 hash. Work only on copies. Evidence that cannot be proven unchanged is weak in court.
- Keep a chain of custody. Record who held the evidence, when and why, with each entry linked to the last. A broken chain lets the other side question the evidence. Hash-chained logs make tampering detectable.
- Communicate carefully. Tell the right people at the right time: management, affected users, the bank, and the authorities such as the Nepal Police Cyber Bureau. Use one spokesperson. Rumours spread faster than facts.
- Learn and improve. After recovery, hold a blameless review and fix root causes. Update detection rules, backups and training. The same incident should never surprise the team twice.
6.7 Summary and exercises
Detection quality is measured by TPR, FPR and precision at the real base rate; Bayes' rule shows why a low prevalence yields mostly false alarms; incident response follows preparation, detection and analysis, containment, eradication and recovery, and post-incident learning; and forensic work depends on hashing, volatility order and an auditable chain of custody.
- Compute TPR, FPR and precision for TP=45, FN=5, FP=200, TN=9,750.
- A detector has TPR 95% and FPR 2% where prevalence is 0.5%. Compute P(malicious | alert).
- Why is accuracy a poor metric for intrusion detection? Give an example.
- List the four incident response phases and one activity in each.
- Explain order of volatility with a list of five evidence sources.
- Describe how a hash chain makes a custody log tamper-evident, and what it cannot prove.
Model answers: medium (5 marks) and long (10 marks) questions
Q1 (5 marks). What is the base-rate fallacy? Show with a numerical example why a 99% accurate detector can still give mostly false alarms.
Introduction. The base-rate fallacy is the mistake of judging a detector only by its true-positive and false-positive rates while ignoring how rare the real events are.
In security data malicious events are very rare, so even a small false-positive rate produces a flood of false alarms (section 6.3).
Example. A detector has a true-positive rate (TPR) of 99% and a false-positive rate (FPR) of 1%. It monitors 100,000 events of which 100 are malicious (prevalence 0.1%).
| Alert | No alert | Total | |
|---|---|---|---|
| Malicious | TP = 99 | FN = 1 | 100 |
| Benign | FP = 999 | TN = 98,901 | 99,900 |
Calculation (Figure 6.2). Alerts = 99 + 999 = 1,098. By Bayes' rule, P(malicious | alert) = 0.99 x 0.001 / (0.99 x 0.001 + 0.01 x 0.999) = 0.00099 / 0.01098 = 9.02%. Accuracy is (99 + 98,901) / 100,000 = 99.00%, a number that hides the problem.
Meaning. Only about 1 alert in 11 is real. At 5 minutes per alert, the team spends about 91.5 hours a day on triage.
Remedy. Reduce FPR rather than only raise TPR. At FPR 0.10% precision rises to 49.77%, and at 0.01% to 90.83%. Tune rules, whitelist known-good activity and combine signals before alerting.
Q2 (5 marks). Explain the incident response lifecycle with the actions in each phase.
Introduction. An incident is an event that actually or potentially harms confidentiality, integrity or availability.
NIST SP 800-61 describes a four-phase lifecycle that organisations follow so that they respond in an orderly way rather than panic (section 6.4 and Figure 6.3).
- Preparation. Write the incident response policy, form and train the team, set up logging and backups, and keep contact lists. This phase decides how well the other three go.
- Detection and analysis. Alerts from IDS, logs and user reports are triaged. The team confirms whether it is a real incident, finds its scope and severity and starts collecting evidence.
- Containment, eradication and recovery. Contain the damage by isolating hosts or blocking accounts, remove the root cause such as malware or a stolen credential, and restore systems from clean backups while watching for reinfection.
- Post-incident activity. Hold a lessons-learned meeting, write a report and update controls and training.
| Phase | Key output |
|---|---|
| Preparation | Plan, tools, trained team |
| Detection and analysis | Confirmed incident, scope, evidence |
| Containment, eradication, recovery | Systems cleaned and restored |
| Post-incident | Report, improved controls |
Conclusion. The arrow from lessons learned back to preparation makes the lifecycle a cycle; each incident leaves the organisation stronger.
Q3 (10 marks). Explain digital forensics: the principles, the process, and how chain of custody and hashing preserve the integrity of evidence.
Introduction. Digital forensics is the identification, preservation, analysis and presentation of digital evidence in a way that is acceptable to a court or a disciplinary panel.
Because digital data is easy to change, the process is designed to prove that the evidence has not changed (section 6.5).
Principles. Never work on the original, document every action, and be able to repeat the result with the same tools. The examiner must be able to explain each step to a non-technical judge.
Process.
- Identification and seizure. Decide what could hold evidence: laptops, phones, servers, cloud accounts and logs. Photograph the scene and label each item.
- Preservation. Connect the disk through a write blocker and create a bit-for-bit image with a forensic imager (Plate 6.1). Compute the SHA-256 hash of the original and of the copy; equal hashes show that the copy is exact.
- Analysis. Examine only the verified copy: files, deleted data, logs, browser history and timelines. Volatile data such as memory is captured first because it disappears at power-off.
- Reporting and presentation. Write findings with the methods, tools and hash values so another examiner can verify them.
Hashing. A SHA-256 digest is a 256-bit fingerprint of the data. Changing one bit changes the digest completely. In the worked example the evidence digest began e756a790143143e7.
A hash proves the data has not changed since it was hashed, so it must be taken at the earliest possible moment.
Chain of custody. A chain-of-custody log records who held the evidence, when, where and why. In the hash-chained log of Figure 6.4, each entry contains the hash of the previous entry.
The 3-entry log verified as True; after one note in entry 2 was edited it verified False, because entry 3 no longer matched. This makes silent tampering detectable.
| Element | Purpose |
|---|---|
| Write blocker | Stops writes to original disk |
| Bit-for-bit image | Exact working copy |
| SHA-256 hash | Proves integrity |
| Custody log | Proves who handled it |
| Documentation | Allows repetition by others |
Legal link. In Nepal, electronic records are accepted as evidence under the Electronic Transactions Act 2063, but their value depends on this proof of integrity and handling (Unit 7).
Conclusion. Good forensics combines technical tools with careful paperwork. Without hashing and custody records even correct findings can be rejected.