Unit 1 · 20 min read
From Idea to Capstone: Framing a Data Project, Scope and Ethics
What the syllabus asks for 6
- What changes in Project IV
- The running example: SikshyaSignal
- The pipeline and where the computing lives
- Building the dataset and meeting the accuracy trap
- Should this project use machine learning at all?
- Eight reasons capstone data projects fail, and the cure
Projects I to III asked "does the system work?". The final-year capstone asks a harder question: "is the decision it makes good, fair and defensible?" A model that labels a student "at risk" can change how teachers treat that student.
So Project IV needs more than code. It needs a problem that is worth solving, data that is honestly collected, a result that is honestly measured, and a student who can explain every choice in front of an examiner.
- The five things that change when a project moves from building systems to making decisions about people.
- A numbered problem statement, measurable objectives and a scope table for the running example, SikshyaSignal.
- A pipeline figure (data, features, model, service, human) and a decision chart: should this project use machine learning at all?
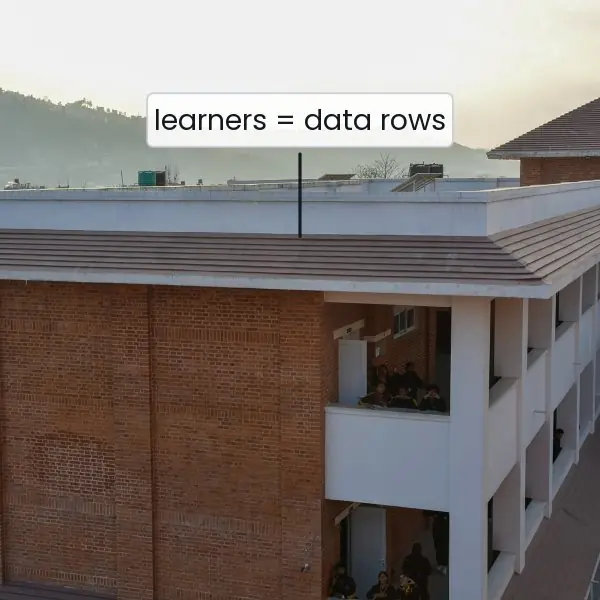
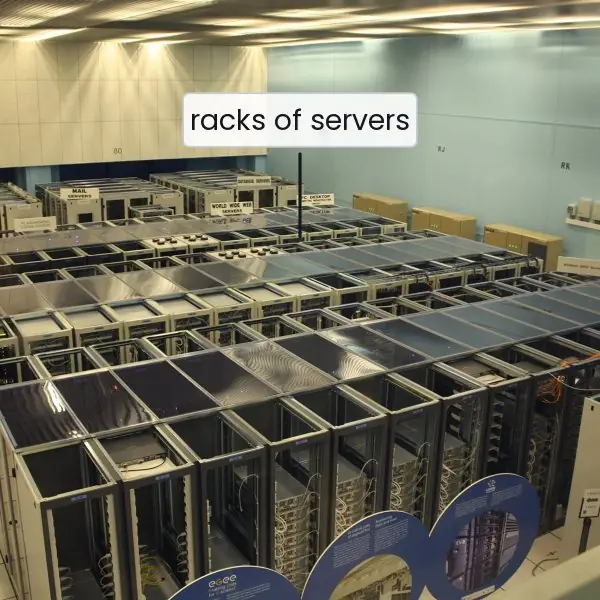
- Real photographs of the people, hardware and rooms behind a data project, and a first executed script that builds the dataset and shows the accuracy trap.
1.1 What changes in Project IV
A capstone is judged by the same panel that will judge your career story, so it carries more weight. Five things change compared with Projects I to III.
| Concern | Project III (sensor system) | Project IV (decision system) |
|---|---|---|
| Output | a reading or an alert | a judgement about a person that someone may act on |
| Quality test | does it run, is the sensor accurate | precision, recall, fairness, and an honest baseline |
| Data | measured by a device | personal, sensitive, often biased, must be protected |
| Failure cost | spoiled crop | a student wrongly labelled, or a struggling student missed |
| Defence | demo and viva | demo, viva, ethics questions and a reproducibility check |
Because of this, the Project IV report has chapters that the earlier reports do not: a data chapter (where it came from, consent, cleaning), an evaluation chapter (with a baseline), a fairness and privacy chapter, and a limitations chapter that says plainly what the system cannot do.
1.2 The running example: SikshyaSignal
SikshyaSignal is invented for this book. A private college in Kathmandu has 600 first-year BCA students. Teachers learn that a student is in trouble only when the internal exam result arrives, which is too late for extra classes.
About one student in four fails at least one subject.
Problem statement, version 1. "Roughly 23 percent of first-year students fail a subject, and the college learns this only after the internal exam, six weeks before the final. Teachers cannot visit 600 students, but they can talk to 40.
A tool that ranks students by risk from attendance, assignments and internal marks could point the teachers to the right 40 early enough for two remedial weeks."
Objectives (SMART).
| # | Objective | How it is measured at the defence |
|---|---|---|
| O1 | A simulated dataset of 600 students is built and documented | data sheet with every column, range and source |
| O2 | The model beats the "nobody is at risk" baseline on recall, not only accuracy | recall on the held-out test set |
| O3 | Of the top 10 percent ranked (12 of the 121 test students), at least 60 percent really fail | precision at the top 10 percent, on the test set |
| O4 | Risk rates are checked across two student groups | group table, gap reported honestly |
| O5 | A prediction service answers in under 100 ms and passes 8 unit tests | test log, timing script |
Scope table.
| In scope | Out of scope (future work) |
|---|---|
| tabular data, logistic regression written with NumPy, evaluation, group check, a small JSON prediction service, drift monitor, report and viva | deep learning, real student records, automatic marks or admission decisions, mobile app, multi-college use |
Notice that objective O2 names the metric. "The model is accurate" can never be examined; "recall of at least 60 percent on the test set" can.
1.3 The pipeline and where the computing lives
Every data project, from a tiny capstone to a bank's fraud system, has the same chain of stages, and every stage can fail on its own.
- Data from the real world: attendance sheets, marks, assignment logs.
- Features: numbers prepared from the data, such as attendance percentage.
- Model: a function that turns features into a risk score between 0 and 1.
- Service: code that takes one student's features and returns the score.
- Human decision: a teacher reads the ranked list and decides whom to meet.
- Feedback: the end-of-term result is stored and used to check the model.

Figure 1.1 shows why a capstone cannot be judged by the model alone. A perfect model fed by wrong attendance sheets is useless, and a perfect list that no teacher reads changes nothing.
The best Project IV reports name the failure of each arrow and what the team did about it.

1.4 Building the dataset and meeting the accuracy trap
The script below creates the 600 simulated students. Each student has a hidden "ability" that nudges attendance, internal marks, assignments and previous GPA, plus random noise; failure is then drawn from a logistic formula.
Because we wrote the simulator, we know the truth, which is useful for learning but never true of real data. The script prints the data sheet, the failure rate and two baselines.
import numpy as np
rng = np.random.default_rng(404)
n = 600
ability = rng.normal(0, 1, n)
attend = np.clip(78 + 4.5*ability + rng.normal(0, 10, n), 30, 100)
internal = np.clip(24 + 5*ability + 0.08*(attend-78) + rng.normal(0, 3.5, n), 0, 40)
assign = np.clip(80 + 6*ability + rng.normal(0, 14, n), 0, 100)
gpa = np.clip(2.9 + 0.45*ability + rng.normal(0, 0.3, n), 1.5, 4.0)
commute = rng.gamma(2.0, 20, n)
valley = rng.random(n) < 0.6
z = -2.0 - 0.05*(attend-78) - 0.18*(internal-24) - 0.01*(assign-80) - 0.8*(gpa-2.9) + 0.006*(commute-40)
risk = rng.random(n) < 1/(1+np.exp(-z))
print("n", n, "at-risk", risk.sum(), f"{risk.mean():.1%}")
for name, v in [("attendance %", attend), ("internal /40", internal), ("assignment %", assign), ("prev GPA", gpa), ("commute min", commute)]:
    print(f"{name:14s} mean {v.mean():6.2f}  sd {v.std():5.2f}  min {v.min():6.2f}  max {v.max():6.2f}")
print("valley share", f"{valley.mean():.1%}", "risk rate valley", f"{risk[valley].mean():.1%}", "outside", f"{risk[~valley].mean():.1%}")
print("baseline: predict nobody at risk -> accuracy", f"{1-risk.mean():.1%}", "recall 0%")
rule = attend < 70
tp = (rule & risk).sum(); fp = (rule & ~risk).sum(); fn = (~rule & risk).sum()
print("rule attendance<70: flagged", rule.sum(), "TP", tp, "FP", fp, "FN", fn, f"precision {tp/(tp+fp):.2f} recall {tp/(tp+fn):.2f}")
n 600 at-risk 138 23.0%
attendance %   mean  78.11  sd 10.69  min  46.82  max 100.00
internal /40   mean  23.74  sd  6.76  min   1.43  max  40.00
assignment %   mean  79.04  sd 14.56  min  24.77  max 100.00
prev GPA       mean   2.87  sd  0.55  min   1.50  max   4.00
commute min    mean  40.48  sd 29.12  min   0.41  max 186.16
valley share 60.3% risk rate valley 22.7% outside 23.5%
baseline: predict nobody at risk -> accuracy 77.0% recall 0%
rule attendance<70: flagged 133 TP 63 FP 70 FN 75 precision 0.47 recall 0.46
Reading the output. Of 600 students, 138 (23.0 percent) fail. The lazy baseline "predict that nobody is at risk" is 77.0 percent accurate yet finds no student at all: recall 0.
This is the accuracy trap: when the rare class is the one you care about, accuracy rewards doing nothing.
The one-line rule "attendance below 70 percent" flags 133 students and catches 63 of the 138 (recall 0.46) with precision 0.47, so more than half of the flags are false alarms and 75 failing students are missed.
Any model in Unit 3 must be compared with both baselines, never with zero.

1.5 Should this project use machine learning at all?
A mature capstone does not start from "I want to use AI". It starts from the problem and asks, honestly, whether a simpler tool would do. Examiners respect a student who tried the simple rule first.

For SikshyaSignal the chart gives: a single rule exists (attendance below 70) but it is weak (Section 1.4), enough history can be collected (previous batches), and the harm screen needs three checks: consent (students are told what is used), bias (the model must not be harsher on one group; Unit 3), and human review (the output is advice to a teacher, never an automatic penalty).
Putting these checks in the proposal, before any code, is what separates a final-year capstone from a class exercise.
1.6 Eight reasons capstone data projects fail, and the cure
- The problem is too vague. "Predict student performance" has no user, no decision and no deadline. Write the problem as in Section 1.2: who acts, on what, how early, and how success is counted. A sharp problem makes every later choice easier.
- The data was never checked. The team trusts the spreadsheet because it opened without an error. Print the range, missing count and mean of every column, as in Section 1.4. Impossible values such as attendance above 100 are the first thing an examiner will look for.
- Accuracy is the only metric. A model that predicts "nobody fails" scores 77 percent here. Always report a baseline, the confusion matrix, precision and recall, and say which matters for the decision. Unit 3 shows how.
- The test set was used for training. The team tunes the model until the test score looks good, so the score no longer measures anything. Split the data once, tune on the training part only, and touch the test set a single time at the end.
- No thought for people. The report never mentions consent, bias or what happens to a wrongly flagged student. Add a harm screen to the proposal, a group check to the evaluation, and a human-review step to the design. Nepal's Individual Privacy Act 2075 makes personal data a legal matter, not only an ethical one.
- A notebook is not a product. The model works on the author's laptop and nowhere else. Save the model as a file, wrap it in a small service with tests, and write the run steps in the README so a stranger can reproduce the demo.
- Nobody plans for change. Next year's batch behaves differently and the model slowly gets worse. Store predictions and outcomes, and compute a drift measure (Unit 4) so the college knows when to retrain.
- The defence is a surprise. The student reads slides and cannot answer "why logistic regression?" or "what if the data is biased?". Prepare the twelve viva questions in Unit 5 and rehearse the demo twice, including the case where the network fails.


Formula and fact sheet
| Item | Formula or fact |
|---|---|
| Accuracy | (TP + TN) / total |
| Precision | TP / (TP + FP): of those flagged, how many were right |
| Recall | TP / (TP + FN): of those who really fail, how many were found |
| Baseline | the score of the simplest possible rule; a model must beat it |
| SMART objective | Specific, Measurable, Achievable, Relevant, Time-bound |
| Pipeline | data, features, model, service, human decision, feedback |
| Simulated data | known truth, no privacy risk, but never proof about real students |
Chapter summary
- A capstone is judged on the quality of the decision and on how honestly it is measured, not only on whether the code runs.
- Write a four-part problem statement and measurable objectives that name the metric.
- A data project is a pipeline of six stages; each arrow can fail, so name the failure of each.
- Accuracy can lie. With 23 percent failures, doing nothing is 77 percent accurate and useless.
- Try the cheapest method first and screen the idea for consent, bias and human review before coding.
- Keep a data sheet for every dataset and say clearly when the data is simulated.
Practice
- List the five concerns that change when a sensor project becomes a decision project.
- Write a four-part problem statement for predicting which students will miss the Dashain-holiday assignment deadline.
- Name the six stages of the pipeline in Figure 1.1 and one failure of each.
- Why is "the model is accurate" a weak objective? Rewrite it as a measurable one.
- In Section 1.4 the do-nothing baseline has 77.0 percent accuracy. Explain why that number is misleading.
- Using the output TP = 63, FP = 70, FN = 75, compute the accuracy of the attendance rule on 600 students.
- State two reasons why simulated data is useful for learning and one reason it can never replace real data.
- What three checks make up the harm screen in Section 1.5?
- Why must the final result be fed back to the system?
- A model flags 50 students and 30 of them really fail; 138 students fail in total. Compute precision and recall.
Answers and worked solutions
1. Output (a judgement about a person), quality test (precision, recall, fairness), data (personal and sensitive), failure cost (wrong label), defence (ethics questions).
2. Example: "Many students submit the assignment due after Dashain late or never. The class teacher learns of it only after the deadline. Using attendance and earlier submission history, a tool could list 15 students on the Monday before the deadline. Success is that at least half of the late submitters are on the list."
3. Data (wrong records), features (bad scaling), model (over-fitting), service (too slow), human decision (advice ignored), feedback (never collected).
4. It cannot be checked. Better: "recall of at least 60 percent and precision at 40 of at least 60 percent on the held-out test set".
5. It comes entirely from the 77 percent of students who do not fail; it finds none of the 138 who do (recall 0), so it is accurate and useless.
6. Errors are FP + FN = 70 + 75 = 145, so correct = 600 − 145 = 455; accuracy = 455 ÷ 600 = 75.8 percent, lower than doing nothing.
7. Useful: known truth for testing, and no privacy risk. Cannot replace real data because real behaviour has patterns the simulator's author never imagined.
8. Consent, bias check, human review.
9. Only the real outcome shows whether predictions were right, and drift is detected by comparing predictions with outcomes over time.
10. Precision = 30 ÷ 50 = 0.60; recall = 30 ÷ 138 = 0.217, about 22 percent.
Model answers: medium (5 marks) and long (10 marks) questions
Q1 (5 marks). Explain the pipeline of a data-driven decision system with a diagram reference and an example.
Introduction. A data-driven decision system turns raw records into advice that a person can act on. It is a chain of stages, and the quality of the final decision can be no better than the weakest stage. Figure 1.1 shows the chain for SikshyaSignal.
The stages.
- Data. Attendance sheets, assignment logs and internal marks are collected with the students' knowledge.
- Features. The data is cleaned and turned into numbers such as attendance percentage, scaled so that no column dominates.
- Model. Logistic regression turns the features into a risk score between 0 and 1.
- Service. A small program takes one student's features and returns the score, and ranks all students.
- Human decision. A teacher reads the top 40 and decides whom to meet. The tool advises; it never punishes.
- Feedback. The end-of-term result is stored so that the model can be checked and retrained.
Example. In the simulated college, 138 of 600 students fail. The service ranks all 600 by score and the teacher meets the top 40, so effort goes where help is most likely to matter.
Why it matters. (i) Each stage can be tested alone. (ii) A weak stage is easy to find. (iii) The feedback arrow shows when the model has gone stale.
Conclusion. Naming the failure of each arrow in the report shows the examiner that the student understands the whole system, not just the model.
Q2 (5 marks). What is the accuracy trap? Explain it with the SikshyaSignal numbers and state which metrics should be reported instead.
Introduction. Accuracy is the share of predictions that are correct. When one class is rare, a useless model can still score high accuracy, and this is called the accuracy trap.
The numbers. In the simulated college 138 of 600 students (23.0 percent) fail. A model that always answers "will not fail" is right for the other 462 students, so its accuracy is 462 ÷ 600 = 77.0 percent.
Yet it finds none of the failing students, so its recall is 0. The attendance-below-70 rule is only 75.8 percent accurate but finds 63 of the 138 failing students (recall 0.46).
| Method | Accuracy | Recall | Precision |
|---|---|---|---|
| Do nothing | 77.0% | 0% | undefined |
| Attendance < 70 rule | 75.8% | 46% | 47% |
What to report. (i) The confusion matrix (TP, FP, FN, TN). (ii) Recall, because missing a failing student is the costly error. (iii) Precision, because teachers have limited time and false alarms waste it.
(iv) The scores of at least one baseline beside the model's score. (v) Precision at the top k, here the top 10 percent of the test students.
Conclusion. A report that gives only accuracy invites the first examiner question: "what would a model that always says no score?" Answer it in the report before it is asked.
Q3 (10 marks). Describe how you would plan a final-year machine-learning project from idea to scope. Use the early-warning example and discuss the problem statement, objectives, the decision to use ML, data, ethics, evaluation and risks.
Introduction. A final-year ML project is a decision system, so its plan must cover the problem, the data, the method, the evaluation and the effect on people.
The running example is SikshyaSignal, which ranks first-year students by risk of failing a subject so that teachers can help early.
1. Problem statement. Write four parts: who is affected (600 first-year students and their teachers), what happens now (failures are noticed six weeks before the final, too late), how big (about 23 percent fail) and what the project will change (a ranked list of 40 students two weeks earlier).
2. Objectives. Make them measurable and name the metric: recall above the baseline, at least 60 percent of the top 10 percent truly failing, a group-gap report, a service answering within 100 ms and eight passing unit tests.
3. Decide whether to use ML. Follow Figure 1.3. A clear rule exists but is weak (recall 0.46). Enough labelled history can be collected from earlier batches. So a model is justified, and the rule becomes the baseline.
4. Data. List every column, its source, unit and valid range, and who may see it. State that the demo data is simulated, with seed 404, so that nothing private is at risk.
5. Ethics and law. Screen for consent, bias and human review. Keep only the columns needed, limit access, and follow the Individual Privacy Act 2075 and the Electronic Transactions Act 2063 in spirit.
6. Evaluation plan. Fix the split before modelling, compare with the do-nothing and rule baselines, and report precision, recall, the confusion matrix and group rates.
7. Risks. Biased or stale data, over-fitting, a model that is ignored, and a wrongly flagged student. Each gets a named cure.
| Plan part | Question it answers |
|---|---|
| Problem and objectives | what exactly will change and how it is counted |
| Method choice | why ML and not a rule |
| Data and ethics | is it available, legal and fair |
| Evaluation | how will we know it works |
Conclusion. A capstone that fixes these seven items before coding gives the supervisor something to review, the student a schedule, and the examiner a clear standard against which to judge the result.