Unit 2 · 7 teaching hours · 18 min read
Technology Adoption and Diffusion of Innovations
What the syllabus asks for 6
- The Technology Acceptance Model
- Diffusion of innovations
- The S-curve: logistic growth
- The Bass diffusion model
- Barriers and resistance
- Seeing the ideas: adoption in hardware, TAM, adopter categories and the two growth curves
Why did mobile wallets spread through Nepali towns in a few years while some excellent software tools never left the lab?
Technology does not spread because it is good; it spreads when people choose to use it, and they choose through perceptions, peers and circumstances. Two research traditions explain this.
The Technology Acceptance Model (TAM) looks at the individual's decision. Diffusion of innovations looks at the whole population over time and gives the S-shaped adoption curve.
Both can be made quantitative, and this unit does so with a small survey (reliability and regression) and with logistic and Bass curves.
- TAM (perceived usefulness, perceived ease of use) and its extensions; Cronbach's alpha and a regression on survey data.
- Rogers' adopter categories derived from the normal curve; characteristics of innovations.
- Logistic S-curve and the Bass model with peak-time calculations.
- Barriers to adoption, resistance and the role of change agents.
2.1 The Technology Acceptance Model
Fred Davis (1989) proposed that a person's behavioural intention (BI) to use a system depends on two beliefs:
- Perceived usefulness (PU): the degree to which the person believes the system will improve their job or life performance.
- Perceived ease of use (PEOU): the degree to which the person believes using it will be free of effort.
PEOU affects PU (an easier system is more useful) and both affect attitude and intention, which lead to actual use. External variables (training, design, social influence) work through PU and PEOU.
TAM2 adds subjective norm (what important others think), image, job relevance and voluntariness.
UTAUT (Venkatesh et al.) unifies several models into four determinants: performance expectancy, effort expectancy, social influence and facilitating conditions (infrastructure and support), moderated by age, gender, experience and voluntariness.
For Nepal, facilitating conditions (data price, electricity, trusted help) and trust are especially important additions, which is why wallet adoption often depends on a family member teaching the first transaction.
A worked survey
Eight respondents rate a new bus-ticketing app on 1–5 scales: four items for PU, three for PEOU, and one for intention to use (BI).
| Resp. | PU1 | PU2 | PU3 | PU4 | PEOU1 | PEOU2 | PEOU3 | BI | PU mean | PEOU mean |
|---|---|---|---|---|---|---|---|---|---|---|
| 1 | 5 | 5 | 4 | 5 | 4 | 4 | 5 | 5 | 4.75 | 4.33 |
| 2 | 4 | 4 | 4 | 3 | 3 | 4 | 3 | 3 | 3.75 | 3.33 |
| 3 | 2 | 3 | 2 | 2 | 2 | 2 | 3 | 2 | 2.25 | 2.33 |
| 4 | 5 | 4 | 5 | 5 | 5 | 5 | 4 | 5 | 4.75 | 4.67 |
| 5 | 3 | 3 | 4 | 3 | 3 | 2 | 3 | 3 | 3.25 | 2.67 |
| 6 | 4 | 5 | 4 | 4 | 4 | 4 | 4 | 4 | 4.25 | 4.00 |
| 7 | 2 | 2 | 1 | 2 | 2 | 1 | 2 | 1 | 1.75 | 1.67 |
| 8 | 3 | 4 | 3 | 3 | 4 | 3 | 3 | 4 | 3.25 | 3.33 |
Reliability. Do the items of one scale measure the same thing? Cronbach's alpha for k items is α = k/(k − 1) × (1 − Σσᵢ² / σ²_total), where σᵢ² is each item's sample variance and σ²_total the variance of the sum score.
For PU, α = 0.949; for PEOU, α = 0.903. A value above 0.7 is conventionally acceptable, so both scales are reliable (with only eight respondents, that is a classroom illustration, not evidence).
Relationships. The Pearson correlation between PU mean and BI is 0.944, between PEOU mean and BI 0.964, and between PU and PEOU 0.975.
PU and PEOU are very strongly correlated here, which is TAM's PEOU → PU link but also a warning: with such multicollinearity the regression below cannot separate their effects reliably. Regressing intention on both means gives
BI = -0.969 + 0.090 × PU + 1.224 × PEOU, R² = 0.930.
For a user who scores both PU and PEOU at 4, the model predicts BI = 4.29. The small coefficient on PU despite its high correlation is the multicollinearity effect; a larger sample would be needed before claiming that ease of use matters more than usefulness.
2.2 Diffusion of innovations
Everett Rogers defined diffusion as the process by which an innovation is communicated through channels over time among the members of a social system. Four elements: the innovation, communication channels, time and the social system.
Five perceived attributes of an innovation predict its speed:
| Attribute | Meaning | Mobile-wallet example |
|---|---|---|
| Relative advantage | Better than what it replaces | No queue to pay the electricity bill |
| Compatibility | Fits values, habits, needs | Works with Nepali interface and existing bank account |
| Complexity | Hard to understand (slows adoption) | Registration needing many steps |
| Trialability | Can be tried on a small scale | Rs 10 first top-up |
| Observability | Results visible to others | Shopkeepers displaying QR codes |
The innovation-decision process has five stages: knowledge, persuasion, decision, implementation and confirmation.
Opinion leaders (respected people in a community) and change agents (the professionals who promote the innovation: extension workers, bank agents) speed adoption; homophily (people trust others like themselves) means the message must come from similar people.
Adopter categories from the normal curve
Rogers observed that the time to adopt is roughly bell-shaped in the population and cut the curve at multiples of the standard deviation σ from the mean adoption time:
| Category | Cut-offs (σ from mean adoption time) | Normal-curve area | Rogers' rounded share |
|---|---|---|---|
| Innovators | below −2σ | 2.28% | 2.5% |
| Early adopters | −2σ to −1σ | 13.59% | 13.5% |
| Early majority | −1σ to mean | 34.13% | 34% |
| Late majority | mean to +1σ | 34.13% | 34% |
| Laggards | above +1σ | 15.87% | 16% |
Innovators are the adventurous few (2.28% exactly, 2.5% rounded); innovators plus early adopters together are 15.87%.
Marketers speak of a chasm (Moore) between the early adopters and the early majority: techniques that work for enthusiasts (novelty) do not persuade pragmatists (references, support), and many products die in the gap.
Critical mass is the point after which adoption becomes self-sustaining because each adopter makes the next one likelier, which is where network effects enter.
2.3 The S-curve: logistic growth
Cumulative adoption over time is S-shaped: slow, then rapid, then saturating.
A simple model is the logistic function N(t) = K / (1 + e^(−r(t − t₀))), where K is the saturation level, r the growth rate and t₀ the inflection time at which N = K/2. With K = 100%, r = 0.9 per year and t₀ = 6:
| Year t | Adoption % = 100/(1 + e^(−0.9(t−6))) | New adopters this year (points) |
|---|---|---|
| 0 | 0.4 | |
| 2 | 2.7 | 1.6 |
| 4 | 14.2 | 7.9 |
| 6 | 50.0 | 21.1 |
| 8 | 85.8 | 14.7 |
| 10 | 97.3 | 3.6 |
| 12 | 99.6 | 0.6 |
At t = 0 only 0.4% have adopted. The fastest growth occurs at t₀ = 6, where the rate is K·r/4 = 22.5 percentage points a year. The curve is symmetric about t₀, so the first half takes as long as the second.
Planning use: before the inflection point, spending on awareness shows little result; the manager must be patient, or the project is cancelled just before takeoff.
2.4 The Bass diffusion model
Frank Bass (1969) built the S-curve from behaviour: adopters are driven by innovation (external influence, advertising, coefficient p) and imitation (word of mouth, coefficient q). The cumulative fraction of adopters is
F(t) = (1 − e^(−(p+q)t)) / (1 + (q/p)·e^(−(p+q)t)),
and the number of new adopters in a period is m × (F(t) − F(t − 1)), where m is the total market potential. The peak of new adoptions occurs at t* = ln(q/p) / (p + q).
Take p = 0.03, q = 0.40 (typical orders of magnitude for consumer technology) and m = 5,00,000 eventual users of a regional wallet:
| Year t | Cumulative F(t) | Cumulative adopters | New adopters in year |
|---|---|---|---|
| 0 | 0.0% | 0 | 0 |
| 1 | 3.6% | 18,064 | 18,064 |
| 2 | 8.7% | 43,422 | 25,358 |
| 3 | 15.5% | 77,590 | 34,167 |
| 4 | 24.2% | 121,169 | 43,580 |
| 5 | 34.6% | 173,027 | 51,857 |
| 6 | 46.0% | 229,870 | 56,844 |
| 7 | 57.4% | 286,838 | 56,968 |
| 8 | 67.8% | 339,025 | 52,187 |
| 9 | 76.6% | 383,042 | 44,018 |
| 10 | 83.5% | 417,656 | 34,614 |
| 11 | 88.7% | 443,404 | 25,748 |
| 12 | 92.4% | 461,777 | 18,373 |
The theoretical peak time is t* = ln(0.40/0.03)/(0.43) = 6.02 years, when 46.2% of the market has adopted; the largest whole-year increment is in year 7 with about 56,968 new users (the continuous formula m(p+q)²/(4q) gives 57,781 users per year at the instant of peak).
In year 1 the model gives 18,064 adopters; innovation (advertising) alone accounts for only 7.0% of the total pull (p/(p+q)), so word of mouth dominates; by year 12, 92.4% have adopted.
For a manager, the actions are different at the two ends: push advertising and free trials at the start (p), and referral schemes and social proof in the middle (q).
2.5 Barriers and resistance
People resist technology for reasons that deserve respect. Individual: fear of losing a job or status, low skills, habit, distrust, cost. Organisational: inertia, unclear benefit, lack of leadership, inadequate training.
Technical and infrastructural: unreliable power and connectivity, no Nepali-language interface, poor support. Social and cultural: norms about women's phone use, fear of fraud, low trust in digital money.
Policy: unclear rules, high taxes on devices or data.
Strategies: involve users early (participatory design), train and provide local help, run pilots, start with a visible quick benefit, build trust through consumer protection, and adopt gradual migration instead of forcing a sudden switch.
A change agent who respects the existing practice is more effective than one who insists the old way is wrong.
2.6 Seeing the ideas: adoption in hardware, TAM, adopter categories and the two growth curves
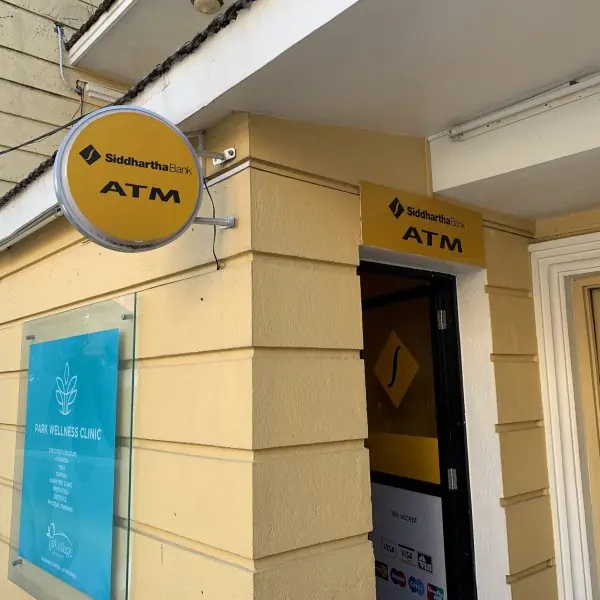
Adoption is visible on the street. Plate 2.1 shows three devices that spread through Nepal in different eras: the basic mobile handset, the smartphone and the bank ATM.




2.6.1 Eight barriers to technology adoption
- Cost. Devices, data packs and subscriptions must fit a family budget. A smartphone that costs a month's income is out of reach for many. Lower prices and instalment plans widen adoption.
- Low perceived usefulness. People adopt only when the tool solves a problem they have. A farmer will use a price app if it shows today's market rate. If it does not, the app stays unused.
- Poor ease of use. Complex menus and foreign-language screens push users away. Nepali-language interfaces and voice options help new users. Simple design often matters more than extra features.
- Lack of trust. People fear fraud, lost money and misuse of data. Early ATMs and wallets grew slowly until trust was built. Clear rules, receipts and complaint channels build it.
- Weak infrastructure. Electricity, signal and bandwidth must be reliable. A rural clinic with frequent power cuts cannot depend on an online system. Investment in networks comes first.
- Skills gap. Users need digital skills and confidence. Training programmes in schools and municipalities reduce fear. Peer helpers are very effective.
- Resistance to change. Habits, jobs and power structures resist new systems. Staff may fear that automation will replace them. Involving them early and explaining benefits lowers resistance.
- Lack of network effects. A wallet is useful only if shops and friends accept it. Until enough people join, each person sees little value. Shared standards such as common QR codes solve this.
Chapter summary
- TAM: PU and PEOU drive intention; UTAUT adds social influence and facilitating conditions; trust matters in Nepal.
- Cronbach's alpha checks scale reliability; correlated predictors (multicollinearity) limit what a small regression can tell.
- Rogers' categories come from the normal curve (2.5, 13.5, 34, 34, 16%); the five attributes of innovations predict speed.
- The logistic curve peaks in rate at t₀; the Bass model combines innovation (p) and imitation (q) with peak time ln(q/p)/(p+q).
- Barriers are individual, organisational, technical, social and policy-related; respect and participation lower resistance.
Practice
- Define PU and PEOU and state the TAM links.
- What does UTAUT add to TAM?
- Cronbach's alpha uses which two variance quantities?
- Why is a regression on two highly correlated predictors unreliable?
- List Rogers' five adopter categories with their percentages.
- Which attribute of innovation does a free trial address?
- For the logistic curve with r = 0.6, what is the maximum growth rate in percentage points per year (K = 100%)?
- For Bass p = 0.02, q = 0.3, compute the time of peak adoption.
- Explain the "chasm" between early adopters and the early majority.
- Give four barriers to adoption of digital payments in rural Nepal and one remedy for each.
Answers and worked solutions
1. PU: belief that the system improves performance. PEOU: belief that it is effortless. PEOU → PU; PU and PEOU → attitude/intention → use.
2. Social influence, facilitating conditions (and moderators such as age, gender, experience), alongside performance and effort expectancy.
3. The sum of the item variances and the variance of the total (sum) score.
4. The predictors move together, so the data cannot say which one causes the effect; coefficients become unstable.
5. Innovators 2.5%, early adopters 13.5%, early majority 34%, late majority 34%, laggards 16%.
6. Trialability.
7. K·r/4 = 100 × 0.6 / 4 = 15 points per year.
8. t* = ln(0.3/0.02)/(0.32) = ln 15 / 0.32 = 2.708/0.32 = 8.46 years.
9. Enthusiasts accept an unfinished product for novelty; pragmatists need references, support and reliability, so firms that cannot provide them stall after the early adopters.
10. Low digital skills (training by agents); no trust (consumer protection, small first transaction); poor connectivity (offline/USSD options); low incentive (cashback, utility-bill convenience).
Model answers: medium (5 marks) and long (10 marks) questions
Q1 (5 marks). Explain the Technology Acceptance Model with a diagram description and a Nepali example.
Introduction. The Technology Acceptance Model (TAM), proposed by Fred Davis in 1989, explains why people accept or reject a new information system (section 2.1 and Figure 2.1).
- Perceived usefulness (PU). The degree to which a person believes the system will improve performance.
- Perceived ease of use (PEOU). The degree to which the person believes using it will be free of effort. PEOU also raises PU, because an easy tool seems more useful.
- Attitude and behavioural intention. PU and PEOU shape the attitude to the system and the intention to use it.
- Actual use. Intention leads to real use.
- External variables. Training, cost, trust and support act on both beliefs.
| Construct | Question the user asks | Example |
|---|---|---|
| PU | Will it help me? | A wallet that pays bills without queues |
| PEOU | Is it simple? | Scan a QR and enter a PIN |
| Intention | Will I use it? | I will pay my electricity bill this way |
Nepali example. A taxpayer will use an online tax portal only if it saves time (PU) and the forms are simple and in Nepali (PEOU). Training and trust, the external variables, decide the rest.
Conclusion. To raise adoption, improve usefulness and ease of use together.
Q2 (5 marks). A technology follows the logistic curve with K = 100%, r = 0.9 per year and t0 = 6. Calculate the adoption at t = 4 and t = 8 and the maximum yearly growth.
Introduction. Cumulative adoption over time is S-shaped, and the logistic function models it as N(t) = K / (1 + e^(-r(t - t0))) (section 2.3 and Figure 2.3).
Calculation at t = 4. The exponent is -0.9 x (4 - 6) = 1.8, so N = 100 / (1 + e^{1.8}) = 100 / (1 + 6.0496) = 14.2%.
Calculation at t = 8. The exponent is -0.9 x (8 - 6) = -1.8, so N = 100 / (1 + e^{-1.8}) = 100 / (1 + 0.1653) = 85.8%. The curve is symmetric about t0, so 14.2% + 85.8% = 100%.
Maximum growth. It occurs at t0 = 6, where N = 50% and the rate is K x r / 4 = 100 x 0.9 / 4 = 22.5 percentage points a year.
| t | 0 | 2 | 4 | 6 | 8 | 10 | 12 |
|---|---|---|---|---|---|---|---|
| Adoption % | 0.4 | 2.7 | 14.2 | 50.0 | 85.8 | 97.3 | 99.6 |
Planning use. Before the inflection point, spending on awareness shows little visible result, but it prepares the take-off. After saturation, growth must come from new products.
Q3 (10 marks). Explain the Bass diffusion model. For p = 0.03, q = 0.40 and a market of 5,00,000 users, find the time of peak adoption and discuss what it tells a planner.
Introduction. Frank Bass (1969) built the S-curve from human behaviour. Adopters are influenced in two ways: by innovation (external influence such as advertising, coefficient p) and by imitation (word of mouth, coefficient q) (section 2.4 and Figure 2.4).
The model. The cumulative fraction of adopters is F(t) = (1 - e^(-(p+q)t)) / (1 + (q/p) e^(-(p+q)t)). New adopters in a year are m x (F(t) - F(t - 1)), where m is the market potential.
Peak time. The peak of new adoptions occurs at t* = ln(q/p) / (p + q) = ln(0.40 / 0.03) / 0.43 = 2.590 / 0.43 = 6.02 years. At that time F = (1 - p/q) / 2 = 46.2% of the market has adopted.
The continuous peak rate is m (p + q)^2 / (4q) = 5,00,000 x 0.1849 / 1.6, about 57,781 users per year.
Year-by-year result.
| Year | Cumulative adopters | New adopters |
|---|---|---|
| 1 | 18,064 | 18,064 |
| 4 | 1,21,169 | 43,580 |
| 7 | 2,86,838 | 56,968 |
| 10 | 4,17,656 | 34,614 |
| 12 | 4,61,777 | 18,373 |
The largest whole-year increase is in year 7, with 56,968 new users, close to the continuous estimate.
Interpretation of p and q. A large p means a fast start driven by advertising; a large q means growth depends on word of mouth, so early users become the marketing channel. When q is much larger than p, the curve is strongly S-shaped with a late, high peak.
Use for a planner. A regional wallet company can see that year 1 brings only 3.6% of the market, so it should expect slow early numbers and plan servers, agents and support for about 57,000 new users a year around the peak.
Referral rewards act on q, and advertising acts on p. After year 10, new-user growth falls, so revenue must come from new services.
Limitations. The model assumes a fixed market size and constant p and q. Price changes, competitors and regulation can change both.
Conclusion. The Bass model explains the S-curve through imitation and gives practical numbers for planning.