Unit 5 · 7 teaching hours · 18 min read
Visual Communication - Tables, Charts, Diagrams and Slides
What the syllabus asks for 7
- Words, tables, charts or diagrams?
- Tables
- Charts: choose by the question
- Colour and accessibility
- Technical diagrams
- Slides and posters
- Seeing the ideas: honest axes, chart choice and contrast
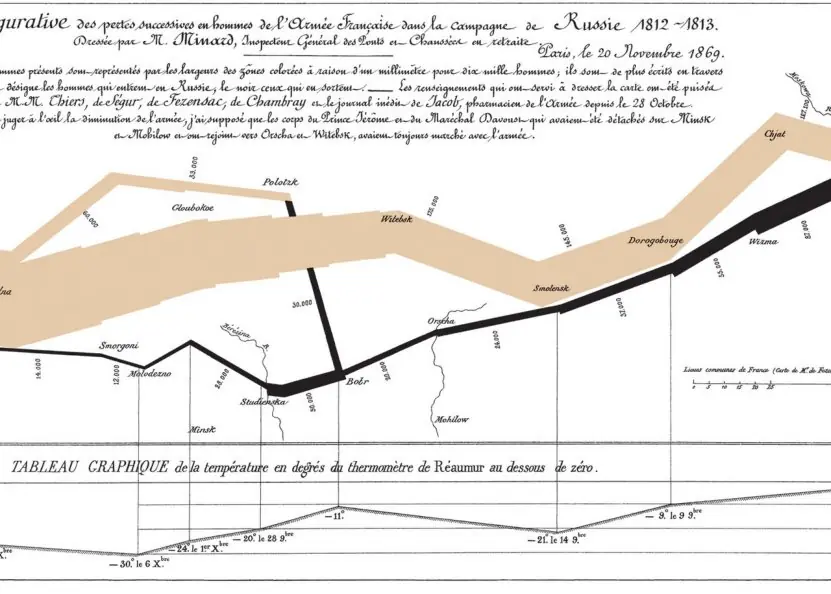
A table of numbers, a flowchart and a well-chosen bar chart can say in seconds what a page of prose cannot. A badly chosen graphic can mislead, sometimes deliberately.
Visual communication in technical writing is therefore both a design skill and an ethical duty: show the data honestly, make it readable by everyone (including readers with colour-vision deficiency), and label it so that it stands on its own.
This unit gives the rules for tables, charts and diagrams, a numerical measure of graphical honesty (Tufte's lie factor), the WCAG contrast ratio computed for common text colours, and guidance for slides and posters.
- Choosing between table, chart and diagram; captions, labels and references in the text.
- Chart types and when to use each; the lie factor and truncated axes; pie-chart angles.
- Colour and accessibility: WCAG contrast ratios computed from the formula.
- Technical diagrams (flowchart, UML, architecture, sequence), screenshots, slides and posters.
5.1 Words, tables, charts or diagrams?
| Use | When | Example |
|---|---|---|
| Prose | Explaining reasoning, narrative, nuance | Why one design was chosen |
| List | Items or steps | Installation steps |
| Table | Exact values, several attributes, lookup | Parameter reference, results of five algorithms on four metrics |
| Chart | Pattern, trend, comparison, distribution | Response time against load |
| Diagram | Structure, flow, relationships | Network layout, data-flow, state machine |
| Photo / screenshot | What something looks like | An interface screen with callouts |
General rules. Every graphic must be necessary (it adds something the text does not), referred to in the text ("Figure 3 shows…") before it appears, numbered and captioned (tables: caption above; figures: caption below, in most styles), and understandable on its own (title or caption saying what it shows, labelled axes with units, a legend if needed, the data source).
Place it near the text that discusses it. State the conclusion in the caption or the sentence introducing it ("Response time doubles above 200 users").
5.2 Tables
Tables are for exact numbers and comparisons.
Make them readable: a clear title; headings that say what each column contains, with units; align numbers on the decimal point (or right-align) so magnitudes are comparable; use the same number of decimals within a column; keep rows and columns few; use light horizontal rules and avoid heavy grid lines; order rows meaningfully (by size or by logical order, not randomly); highlight the key row sparingly; and put sources and notes under the table.
Do not split a small table across pages. Avoid putting a long table in the main text; place it in an appendix and summarise.
5.3 Charts: choose by the question
| Question | Chart | Notes |
|---|---|---|
| Compare values across categories | Bar chart (horizontal for long labels) | Start the value axis at zero |
| Change over time | Line chart | Time on the x-axis; limit to a few lines; a truncated axis can be acceptable for lines if labelled |
| Parts of a whole | Stacked bar or pie (few slices) | Pies are poor for more than five slices or for comparing similar sizes |
| Relationship between two variables | Scatter plot | Add a trend line only if justified |
| Distribution | Histogram or box plot | Say how the bins were chosen |
| Process or sequence | Flowchart / timeline / Gantt | Standard symbols |
| Geography | Map | Use for data that depend on place |
Avoid 3-D effects, decorative backgrounds and "chartjunk"; Edward Tufte's principle of a high data-ink ratio says that ink should show data, not decoration. Use direct labels instead of a legend where possible, and the same colour for the same thing in every figure.
Honest scales and the lie factor
Tufte defines the lie factor = (size of effect shown in the graphic) / (size of effect in the data); an honest graphic has a lie factor close to 1. Truncating the axis of a bar chart is the classic distortion.
Suppose a company's uptime rose from 100 to 105 units, a 5% increase in the data.
If the bars are drawn on an axis that starts at 95, the first bar has height 100 − 95 = 5 and the second 105 − 95 = 10: the graphic shows a 100% increase, so the lie factor is 100 / 5 = 20.0.
The reader would think that the quantity doubled.
Rules: begin bars at zero; if you must truncate (for example on a line chart of a very stable series), mark the break clearly; keep the aspect ratio so that the slope does not exaggerate; do not use area or volume (a bubble twice as high and twice as wide looks four times as big) to encode a single number without noting it.
Pie charts divide 360° in proportion to the shares. Shares of 45%, 30%, 15% and 10% occupy angles of 162°, 108°, 54° and 36° (each angle = share × 3.6°). They sum to 360°. With similar-sized slices the eye cannot rank them, so a sorted bar chart is better.
5.4 Colour and accessibility
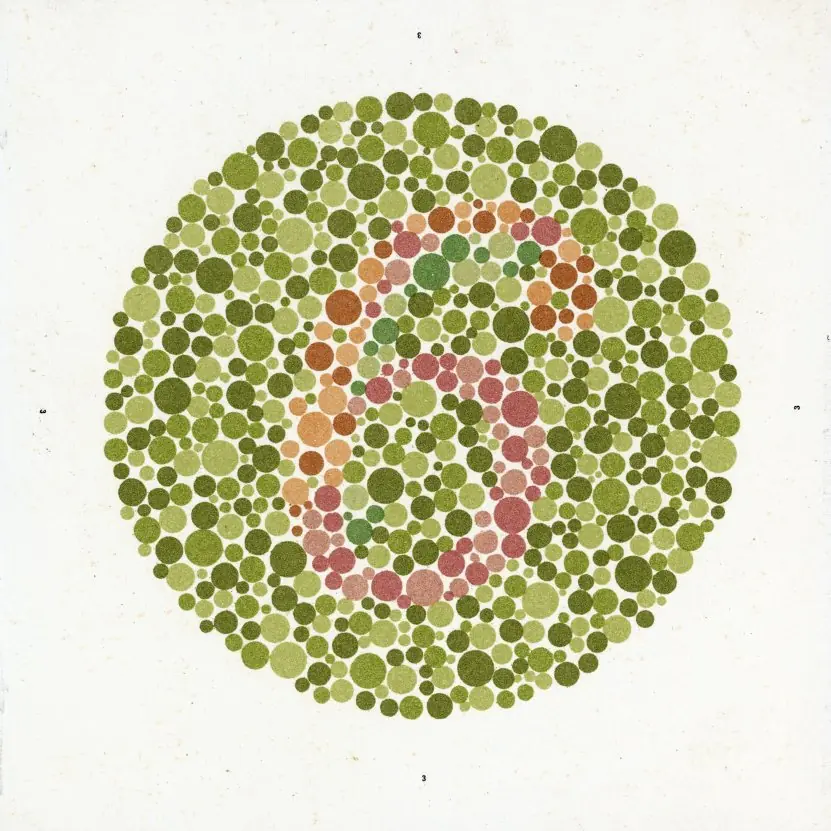
About 1 in 12 men and 1 in 200 women have some colour-vision deficiency, many readers use black-and-white printouts, and screens are read in bright sunlight, so never use colour as the only carrier of meaning: add labels, patterns or shapes.
Use colour palettes that remain distinguishable (colour-blind-safe sets such as the Okabe–Ito palette). Contrast between text and background is the most important factor for legibility.
The Web Content Accessibility Guidelines (WCAG) define a contrast ratio from the relative luminance L of the two colours: with each sRGB channel c (0–1) linearised as c/12.92 if c ≤ 0.03928 else ((c + 0.055)/1.055)^2.4, L = 0.2126·R + 0.7152·G + 0.0722·B, and ratio = (L_lighter + 0.05) / (L_darker + 0.05), from 1:1 (identical) to 21:1 (black on white).
WCAG level AA requires 4.5:1 for normal text (3:1 for large text and graphics); AAA requires 7:1. For text on a white background:
| Text colour on white | Hex | Contrast ratio | WCAG AA (4.5:1) for body text |
|---|---|---|---|
| Black | #000000 | 21.00:1 | pass |
| Blue | #0000ff | 8.59:1 | pass |
| Dark grey | #767676 | 4.54:1 | pass |
| Red | #ff0000 | 4.00:1 | fail |
| Medium grey | #999999 | 2.85:1 | fail |
So a medium grey such as #999999 (2.85:1) fails AA for body text although it looks "clean", while #767676 (4.54:1) is the lightest grey that passes on white. Pure red (4.00:1) just misses the 4.5:1 requirement for small text.
Other accessibility rules: add alt text to every figure (a short description of what it shows and why it matters, or empty alt for pure decoration); caption videos; use real table headers; make sure figures can be understood in grayscale; and avoid text in images.
5.5 Technical diagrams
| Diagram | Shows | Notes |
|---|---|---|
| Flowchart | Steps and decisions of a process or algorithm | Terminator (start/end), process rectangle, decision diamond with labelled Yes/No branches, arrows; one start |
| Data-flow diagram (DFD) | Processes, data stores and external entities | Levels: context (level 0), level 1, level 2 |
| UML (use-case, class, sequence, activity, state) | Software structure and behaviour | Use only the diagrams that answer a question |
| ER diagram | Entities and relationships of a database | Cardinality labels |
| Architecture / deployment diagram | Components, servers, networks, trust boundaries | Layers, labelled connections with protocols (see the C4 model: context, containers, components, code) |
| Sequence diagram | Messages between components over time | Time flows down; good for protocols such as TLS |
| Gantt chart | Tasks and schedule | Show dependencies and milestones |
Principles: one diagram, one message; limit to about seven elements per level of detail and split larger diagrams; consistent shapes and arrow styles; label every arrow; a legend if notation is unusual; left-to-right or top-to-bottom flow; avoid crossing lines; use tools (draw.io, Mermaid, PlantUML, Graphviz) that store diagrams as text or editable files so they can be versioned.
Screenshots: crop to the relevant part, use callouts numbered to match the steps, blur private data, keep them current (they age quickly), and give the text alternative.
5.6 Slides and posters
A presentation supports a speaker; it is not the speech.
Slides: one idea per slide with a sentence-style headline that states the point ("Response time doubles above 200 users", not "Results"); large fonts (at least 24 pt body, 32 pt titles; readable from the back of the room), few words, high contrast, consistent template; one chart or image per slide with the message highlighted; no reading from the slide.
The "6 × 6" rule (at most six lines of six words) is a rough guide.
Structure the talk: tell them what you will say, say it, tell them what you said, with an opening that states the problem, three or four points, a clear conclusion and call to action.
Rehearse with a timer (a common rate is about two minutes per slide), prepare for questions, test the projector and file format, and bring a backup (PDF).
Posters for project exhibitions: a title and authors, the problem and objective, method, results as large figures, conclusion; readable at 1–2 metres; roughly 300–800 words in total; QR code to the demo or repository.
5.7 Seeing the ideas: honest axes, chart choice and contrast


5.7.1 Eight rules for honest and readable visuals
- Choose the graphic from the question. Use a table for exact values, a bar chart to compare categories, a line chart for change over time and a scatter plot for a relationship. A pie chart only works for a few parts of one whole. The wrong chart hides the message even when the data are correct.
- Start bar charts at zero. Bars encode length, so a cut axis changes the story. In Figure 5.1 a 5% rise looks like 100%. If a line chart must be cut, mark the break clearly.
- Give every graphic a message title. "Uptime rose 5% after the upgrade" tells the reader what to see, while "Uptime chart" does not. Add units, axis labels and the source. A reader should understand the figure without reading the paragraph.
- Keep it simple. Remove 3-D effects, heavy grid lines and decoration that carry no data. Use direct labels instead of a legend where possible. A Nepal Rastra Bank report with clean charts is easier to trust than one with shadows and gradients.
- Do not use colour alone. One man in twelve has some colour-vision deficiency, and many pages are printed in black and white. Add labels, patterns or shapes. Use limited, consistent colours so each means one thing.
- Check contrast. Body text needs at least 4.5 to 1 on its background (Figure 5.3). Light grey on white is a frequent failure on slides and websites. Test with a contrast checker before publishing.
- Draw diagrams with a purpose. A diagram should have one idea, consistent boxes and arrows, a legend if needed and labels you can read in print. Flowcharts, block diagrams and network maps each have conventions to follow. Too many boxes on one page become a puzzle.
- Design slides for the room. Use one message per slide, at most about six lines, a font of at least 24 points and a picture instead of a paragraph. Put detail in a handout. A speaker at a college project defence should be heard, not read from the screen.


Chapter summary
- Choose the medium by purpose: tables for exact values, charts for patterns, diagrams for structure; every graphic is referred to, numbered, captioned and self-explanatory.
- Chart type follows the question; bars start at zero; the lie factor measures distortion (a truncated bar chart showing 5% as 100% has a lie factor of 20.0).
- Never rely on colour alone; WCAG contrast needs 4.5:1 for body text; #999999 on white gives 2.85:1 and fails.
- Diagrams carry one message with consistent notation; slides carry one idea with a headline sentence.
Practice
- When would you choose a table instead of a chart?
- Name the right chart foramonthly rainfall over a year,bmarket share of four firms,cheight against weight.
- A bar chart's axis starts at 50; values are 60 and 66. Compute the lie factor.
- Compute the pie-chart angles for shares 50%, 25%, 15%, 10%.
- What are the WCAG AA contrast ratios for normal and large text?
- Why is #999999 on white a poor choice for body text?
- Give three rules for a good table.
- What should a figure caption contain?
- List the standard flowchart symbols and what each means.
- State four rules for effective slides.
Answers and worked solutions
1. When readers need exact values, several attributes per item, or lookup.
2.(a) Line chart (or bars) over time;(b) bar chart (or a pie with few slices);(c) scatter plot.
3. Data: (66 − 60)/60 = 10%. Graphic: bar heights 10 and 16, so (16 − 10)/10 = 60%. Lie factor = 60/10 = 6.
4. 0.5 × 360 = 180°, 0.25 × 360 = 90°, 0.15 × 360 = 54°, 0.10 × 360 = 36° (sum 360°).
5. 4.5:1 for normal text and 3:1 for large text (AAA: 7:1 and 4.5:1).
6. Its contrast ratio is about 2.85:1, below the 4.5:1 needed for readable body text.
7. Numbered caption, headings with units, aligned numbers with consistent decimals, few light rules, meaningful order (any three).
8. What is shown, the main message, units and data source, and enough information to understand it without the text.
9. Rounded terminator (start/end), rectangle (process step), diamond (decision with Yes/No exits), parallelogram (input/output), arrows (flow).
10. One idea per slide, sentence headlines, large fonts and high contrast, minimal text with a clear visual, consistent template, rehearse with a timer (any four).
Model answers: medium (5 marks) and long (10 marks) questions
Q1 (5 marks). Explain the lie factor with an example. How can charts be made honest?
Definition. Tufte's lie factor = (size of effect shown in the graphic) / (size of effect in the data). An honest graphic has a lie factor close to 1.
Example (Figure 5.1). A company's uptime rose from 100 to 105, a 5% increase. If the bars start at 95, their heights are 5 and 10, so the picture shows a 100% rise. Lie factor = 100 / 5 = 20: the reader believes the quantity doubled.
On a zero-based axis the bars are 100 and 105 tall and the factor is 1.
Making charts honest.
- Start bar charts at zero; mark any break on a line chart.
- Keep the aspect ratio reasonable and the scale even.
- Show units, source and sample size.
- Avoid 3-D and area effects that exaggerate size.
- Choose the chart from the reader's question.
Conclusion. A chart is evidence, so its size must match the data. A distorted chart misleads even if every number printed on it is correct.
Q2 (5 marks). What is colour accessibility? Compute and interpret WCAG contrast for the colours given in the unit.
Accessibility. About 1 in 12 men and 1 in 200 women have a colour-vision deficiency; readers also use black-and-white printouts and read in sunlight. So never use colour as the only carrier of meaning, and give text enough contrast with its background.
WCAG rule. The contrast ratio is \dfrac{L_1 + 0.05}{L_2 + 0.05}, where L is relative luminance. WCAG AA asks for 4.5 : 1 for body text and 3 : 1 for large text.
| Text on white | Hex | Ratio | AA body text |
|---|---|---|---|
| Black | #000000 | 21.00:1 | pass |
| Blue | #0000ff | 8.59:1 | pass |
| Dark grey | #767676 | 4.54:1 | pass |
| Red | #ff0000 | 4.00:1 | fail |
| Medium grey | #999999 | 2.85:1 | fail |
Interpretation. #767676 is the lightest grey that still passes on white; #999999 looks neat but fails. Fix by darkening the text, adding a label or pattern, and checking with a contrast tool.
Conclusion accessible design helps everyone, not only people with disabilities.
Q3 (10 marks). Explain how to choose and design tables, charts, diagrams and slides for a technical document.
Introduction. Words, tables, charts and diagrams each carry information best in different cases. The writer must choose by the reader's question and then design the graphic so that it is honest, readable and accessible (Figures 5.1 to 5.3).
1. Tables. Use when readers need exact values or comparisons across several attributes. Rules: a title, clear column headings with units, aligned numbers, consistent decimals, light lines, no empty cells without a note.
2. Charts. Choose by question (Figure 5.2): bar for categories, line for time, scatter for relationships, pie or stacked bar for a few parts of a whole, histogram for distribution. Give a message title, axis labels with units and the data source.
3. Honest scales. Bars start at zero. The lie factor compares the effect drawn with the effect in the data: truncating an axis for a 5% change gives a factor of 20.
4. Colour and accessibility. Do not rely on colour alone; use patterns and labels; keep contrast at 4.5 : 1 or better (#767676 passes at 4.54, #999999 fails at 2.85).
5. Technical diagrams. One idea per diagram; consistent shapes and arrows; labels in readable size; a legend; a caption and a reference in the text. Types: flowchart, block, network, UML, ER and sequence diagrams.
6. Slides and posters. One message per slide, at most about six lines, large type, one picture, and detail in a handout. Rehearse with a timer.
Comparison.
| Need | Best form | Avoid |
|---|---|---|
| exact values | table | chart without labels |
| compare categories | bar chart | pie with 12 slices |
| trend over time | line chart | 3-D bars |
| relationship | scatter plot | dual axes without warning |
| process | flowchart | paragraph of steps |
| talk | slide with one idea | slide of full sentences |
Conclusion. Good visuals are chosen by the question, drawn with honest scales and checked for contrast, so they let the reader see the point in seconds without being misled.