Unit 5 · 19 min read
Field Test, Report, Demo and Viva for Project III
What the syllabus asks for 7
- The field-test plan
- The report
- The demo: ten minutes, with a plan B
- Honesty, consent and ethics
- Twelve viva questions with short model answers
- An illustrative marking rubric
- Eight habits of teams that finish Project III well
A sensor project is finished only when it has been tested outside the lab and the results are reported honestly against the objectives written in Unit 1.
This unit shows how to run a 48-hour field test, turn the log into a pass-or-fail table, structure the report, plan a ten-minute demo that survives a bad network, and answer the viva.
- A field-test plan and a script that checks every objective O1 to O5 and prints PASS or FAIL.
- A report map with a page budget, and a demo timeline with a plan B for each risk.
- Ethics and honesty rules for sensor data, photographs and farmers' consent.
- Twelve viva questions with model answers, an illustrative rubric and eight habits of successful teams.
5.1 The field-test plan
Desk tests prove that code runs; a field test proves that the system works in rain, sun, distance and weak signal. Plan it like an experiment.
| Item | Plan for KhetSense |
|---|---|
| Duration | 48 hours, containing one night, one morning irrigation, and (if possible) rain |
| Placement | 6 soil nodes on 6 terraces, 1 weather node, gateway in the farmhouse |
| What is logged | every received message, battery voltage, signal strength, app sync events |
| Reference measurements | 10 oven-dry soil samples paired with probe counts (Unit 2) |
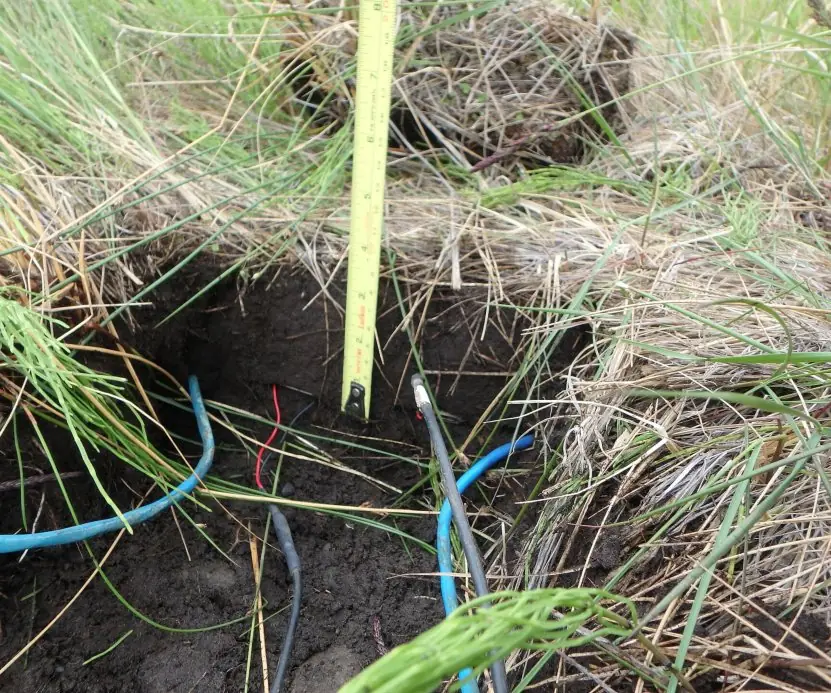
| Safety | sealed boxes, cable drip loops, landowner's permission, no work on wet slopes in rain |
| Failure rule | any fault is written in a log; failed targets are reported, not hidden |
After the test, the log is reduced to one table that answers the five objectives. The script below simulates a 48-hour log and prints that table. Node 5 is placed far from the gateway, so it has a weaker link.
import numpy as np
rng = np.random.default_rng(31)
STEPS = 2 * 96
loss = {1: 0.010, 2: 0.015, 3: 0.020, 4: 0.010, 5: 0.060, 6: 0.015}     # residual loss after QoS 1 retries
worst = {}
for node, p in loss.items():
    got = rng.random(STEPS) > p
    day1, day2 = 96 - got[:96].sum(), 96 - got[96:].sum()
    worst[node] = int(max(day1, day2))
o1 = all(v <= 4 for v in worst.values())
pairs_err = np.abs(rng.normal(0, 1.8, 10))                                # |probe - oven-dry| for 10 samples
o2 = pairs_err.mean() <= 3
avg_ma = 0.62                                                             # measured with a multimeter
days = 2000 / avg_ma / 24
o3 = days >= 30
o4, cost = True, 26700                                                    # aeroplane-mode demo passed; kit cost
rows = [("O1 readings every 15 min, <=4 missing/day/node", f"worst per node {worst}", o1),
        ("O2 mean error <= 3 points", f"{pairs_err.mean():.2f} points on 10 samples", o2),
        ("O3 battery >= 30 days", f"{avg_ma} mA -> {days:.0f} days", o3),
        ("O4 phone shows latest reading offline", "demo passed", o4),
        ("O5 kit under Rs 30,000", f"Rs {cost:,}", cost < 30000)]
for name, value, ok in rows: print(f"{'PASS' if ok else 'FAIL'}  {name:50s} {value}")
print("objectives met:", sum(r[2] for r in rows), "of 5")
FAIL  O1 readings every 15 min, <=4 missing/day/node     worst per node {1: 1, 2: 5, 3: 2, 4: 1, 5: 9, 6: 1}
PASS  O2 mean error <= 3 points                          1.23 points on 10 samples
PASS  O3 battery >= 30 days                              0.62 mA -> 134 days
PASS  O4 phone shows latest reading offline              demo passed
PASS  O5 kit under Rs 30,000                             Rs 26,700
objectives met: 4 of 5
Reading the result table. Four of five objectives are met, and one honestly fails. O1 fails because node 2 lost 5 readings and node 5 lost 9 on its worst day, against the limit of 4.
The cause is clear from the setup: node 5 is farthest from the gateway. The report should say so, show the log, and propose a fix (a better antenna position or a relay node) rather than quietly relaxing the target.
Note that O4 was entered by hand because it is a demonstration, not a measurement; a table may mix both kinds as long as it says which is which.
A project that reports "4 of 5, with a diagnosed failure" earns more trust than one that reports "5 of 5" without evidence.
5.2 The report
A Project III report follows the same skeleton as Project I and II, with extra evidence for hardware and data. College formats differ, so treat this as a checklist.

The script below checks a page budget so that no chapter is forgotten and the total fits the college limit.
budget = {"Introduction + objectives": 5, "Literature + similar systems": 6, "Requirements + design": 9,
          "Hardware + firmware": 10, "Data + analysis": 10, "Mobile app": 8, "Field test + results": 9,
          "Conclusion + future work": 3}
limit, front, back = 80, 8, 12            # college limit (check yours), front matter, appendices
body = sum(budget.values())
for k, v in budget.items(): print(f"{k:30s} {v:3d} pages {'#' * v}")
print(f"body {body} + front {front} + appendices {back} = {body + front + back} pages; college limit {limit}")
print("fits:", body + front + back <= limit, "| technical share:", round(100 * (10 + 10 + 8 + 9) / body), "% of body")
Introduction + objectives        5 pages #####
Literature + similar systems     6 pages ######
Requirements + design            9 pages #########
Hardware + firmware             10 pages ##########
Data + analysis                 10 pages ##########
Mobile app                       8 pages ########
Field test + results             9 pages #########
Conclusion + future work         3 pages ###
body 60 + front 8 + appendices 12 = 80 pages; college limit 80
fits: True | technical share: 62 % of body
5.3 The demo: ten minutes, with a plan B
A demo is a performance with a risk list. Hardware demos fail more often than software ones: a cable falls out, Wi-Fi at the college is blocked, a battery is flat. The rule is for every risk, carry a plan B.

5.4 Honesty, consent and ethics
- Say what is real and what is simulated. If a graph comes from a simulator, write "simulated". Mixing real and simulated data without saying so is academic dishonesty.
- Ask permission. Place nodes only on land with the owner's permission, and give the farmer a short written consent explaining what is recorded. Never publish a farmer's name or plot location without agreement.
- Credit sources. Cite datasheets, libraries and photographs with their licence. Open-licensed photographs may be used with credit; most web images may not.
- Respect the law. Under Nepal's Electronic Transactions Act 2063 unauthorised access to computer data is an offence, so use your own accounts, devices and test servers only.
- Report failures and limits. The failed O1 in Section 5.1 is better reported with a diagnosis than hidden.
The budget gives 60 body pages, 80 pages in total, exactly at the assumed college limit of 80, and 62 percent of the body is hardware, data, app and field-test evidence. If your college limit is lower, cut the literature chapter first, not the field test.
5.5 Twelve viva questions with short model answers
- Why did you choose the ESP32 instead of an Arduino Uno? It has built-in Wi-Fi and a deep-sleep mode with very low current; the Uno needs an extra module to send data and uses more power in sleep.
- How do you know the soil readings are accurate? I calibrated against 10 oven-dry samples and tested the fitted line on 5 new ones; the mean error was 0.32 points in the simulation and 1.23 points in the field test, against the target of 3.
- What does your sensor measure physically? The probe is capacitive: soil water changes the permittivity between its plates, which changes an oscillator, and the board converts the output voltage to a count.
- What happens if the Wi-Fi drops? The node keeps readings in memory and sends a batch when the link returns; QoS 1 retries until acknowledged, and the server ignores duplicates by id.
- Why did objective O1 fail? Nodes 2 and 5 lost 5 and 9 readings on their worst day; node 5 is far from the gateway. I propose moving the antenna or adding a relay node.
- Why use a median filter? A single spike never becomes the middle value, so it is ignored; in the test the median cut the mean error from 1.67 to 0.58 points.
- How long does the battery last? 2,000 mAh usable divided by the measured average of 0.62 mA gives about 134 days; I measured the current with a multimeter, not from the datasheet.
- How is your forecast better than just using the current value? It models the drying curve, giving 0.58 points of error against 1.31 for persistence, but the test had only six qualifying evenings and excluded rain.
- What does the app show without internet? The last saved readings from the local database, an age label, and a queue of waiting actions; advice is hidden if the data are older than two hours.
- How do you avoid duplicate actions? Each action carries a unique id made on the phone; the server stores applied ids and answers "duplicate" for repeats.
- What data privacy steps did you take? The app asks only for internet access, stores only plot readings, uses HTTPS and a one-time-code login, and no farmer's name is published without consent.
- What would you do with another month? Add valve control with a manual override, calibrate for sandy and clay soils, run a 30-day field test, and compare the forecast with the agriculture officer's advice.
5.6 An illustrative marking rubric
TU does not publish a Project III rubric. The table below is an invented example to help you self-check; your department's sheet always wins.
| Criterion | Weight | Full marks need |
|---|---|---|
| Problem and objectives | 10 | measurable, numbered objectives |
| Design and hardware | 20 | architecture, parts table, circuit photo, budget |
| Data and analysis | 20 | cleaning, calibration error, forecast against baseline |
| Mobile app and offline behaviour | 15 | working screens, sync demonstrated |
| Testing and results | 15 | field-test table, failures reported |
| Report and viva | 20 | clear structure, honest limits, confident answers |
5.7 Eight habits of teams that finish Project III well
- Start with the field, not the code. Visit the farm in week 1, measure something by hand, and write a problem statement with a number. A real number such as "35 percent of water wasted" gives the whole project a purpose and a way to be judged.
- Order and test hardware early. Parts take two to four weeks to arrive from Kathmandu or abroad, and half of them need replacing. Test each sensor on the table in week 3. A late, broken sensor is the most common reason for a failed demo.
- Build the simulator first. A script that produces fake readings lets the server, the analysis and the app be developed before the hardware works. Later, swap the simulator for the real node without changing anything else.
- Log everything. Keep a dated notebook of wiring, code versions, measurements and faults, with photographs. The log is the evidence for the field-test chapter and answers many viva questions.
- Measure, do not guess. Use a multimeter for current, an oven-dry sample for moisture and a stopwatch for latency. Numbers with units and conditions make the report convincing.
- Keep the three parts loosely coupled. The node only publishes messages, the server only stores and analyses, and the app only reads the API. Then one broken part does not stop work on the others, and each can be tested alone.
- Rehearse the demo with its plan B. Run the ten-minute demo three times, once with the network unplugged. Carry screenshots, a short video and a printed result table so that a failure becomes a talking point, not a disaster.
- Write the report as you go. After each unit of work, write one page with a figure and a result. A report written in the last week is shallow, whereas one grown over the semester is deep and honest.

Formula and fact sheet
- Field test: at least 48 hours, outdoors, with a log; report PASS or FAIL against each numbered objective.
- Missing per day = expected readings − received readings (96 per day at 15-minute steps).
- Battery days = usable mAh ÷ measured mA ÷ 24.
- Report = objectives, design, hardware, data, app, field test, conclusion, plus appendices; check the college page limit.
- Demo = 10 minutes, one plan B per live step.
Chapter summary
- A field test turns claims into evidence: the simulated 48-hour log passed four of five objectives and honestly failed O1.
- The failed objective is diagnosed (far node, weak link) and a fix is proposed; hiding it would be dishonest.
- The report map highlights the sensor-specific chapters; the page budget came to 80 pages with 62 percent technical content.
- The demo is rehearsed with a plan B for every live step, including an offline run.
- Honesty, consent, licensing and the law apply to sensor data and photographs as much as to code.
Practice
- Why is a desk test not enough for an IoT project?
- List four things that should be logged during a field test.
- In the table of Section 5.1, why did O1 fail and what should the report say?
- Why is O4 marked "demo passed" and not given a number?
- Name three chapters of the report that are specific to a sensor and mobile project.
- Give a plan B for a live Wi-Fi demo.
- Why should the simulator be built first?
- A node must send 96 readings a day and sent 91. How many are missing, and does it meet "at most 4 missing per day"?
- A node averages 0.8 mA from a 2,400 mAh cell with 80 percent usable. How many days does it last?
- Name two ethical duties when placing a node on a farmer's land.
Answers and worked solutions
1. Rain, sun, distance and weak signal change behaviour that the table never shows.
2. Received messages, battery voltage, signal strength and app sync events (also faults and weather).
3. Nodes 2 and 5 lost 5 and 9 readings on their worst day, above the limit of 4; node 5 is far from the gateway. The report should show the log, name the cause and propose a fix.
4. It is a pass-or-fail demonstration, not a measurement.
5. Hardware and firmware, data and analysis, mobile app, field test and results (any three).
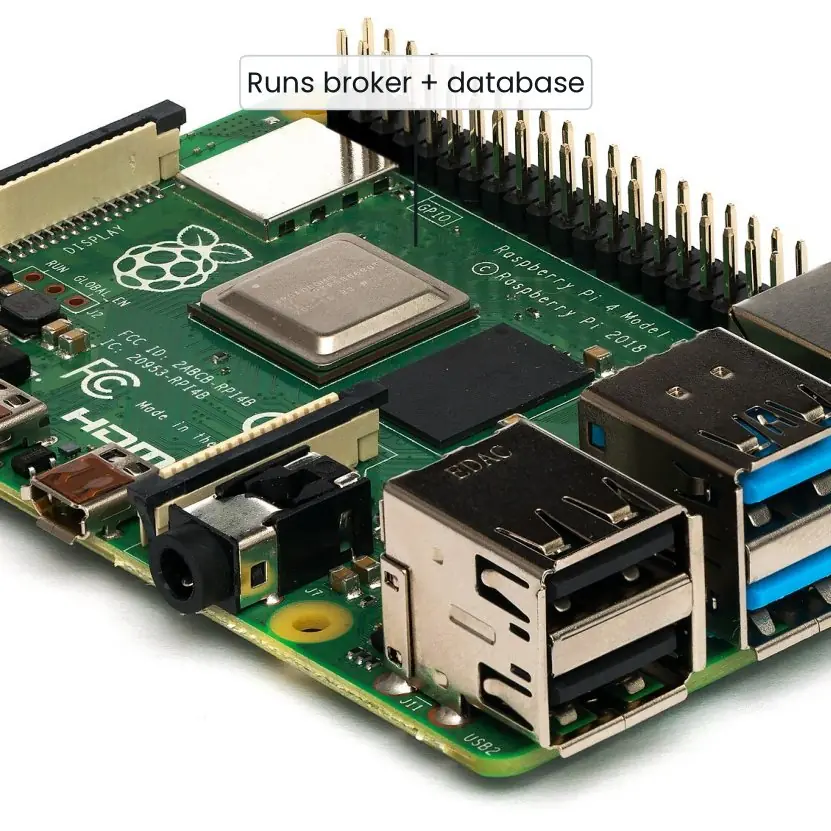
6. Run the broker on a Raspberry Pi on the table, or show a recorded video and a saved screenshot.
7. Server, analysis and app can be built and tested before the hardware works.
8. 96 − 91 = 5 missing; 5 is more than 4, so it fails.
9. Usable 2,400 × 0.8 = 1,920 mAh; 1,920 ÷ 0.8 = 2,400 hours = 100 days.
10. Ask the landowner's permission and obtain consent; do not publish names or locations without agreement.
Model answers: medium (5 marks) and long (10 marks) questions
Q1 (5 marks). Why is a field test necessary for an IoT project? Describe how you would plan and report one.
Introduction. A field test runs the complete system in the real environment for long enough to expose problems that a desk test cannot show. Weather, distance, battery ageing and weak networks only appear outdoors.
Planning.
- Duration and placement. At least 48 hours, including a night and an irrigation event, with nodes on the real terraces and the gateway at its real position.
- Logging. Record every received message, battery voltage, signal strength and app sync events, so that every result can be recomputed.
- Reference measurements. Collect paired reference data, such as ten oven-dry samples, to measure accuracy.
- Safety and permission. Seal the boxes, avoid wet slopes and obtain the landowner's consent.
Reporting. Reduce the log to a table of objectives with the measured value and PASS or FAIL. In the KhetSense example, four objectives passed and O1 failed because nodes 2 and 5 lost 5 and 9 readings on their worst day against a limit of 4.
Honesty. A failed target is reported with its cause and a proposed fix.
Conclusion. A planned, logged and honestly reported field test is the main evidence that an IoT project works in reality.
Q2 (5 marks). Describe how to prepare and run a ten-minute demonstration of a hardware and mobile project. Why is a plan B needed?
Introduction. A demonstration shows the examiner the working system in a short time. Hardware demos carry more risk than software ones, so preparation is as important as the project itself.
Preparation.
- Timeline. Divide ten minutes into steps: problem and objectives (1 min), live sensor reading (2), data on the server (2), app advice (2), offline test (1), results and questions (2).
- Local setup. Run the broker and database on a small gateway board such as a Raspberry Pi on the table, so that the college network is not needed.
- Rehearsal. Run the full demo three times, once with the network unplugged and once with a flat-battery node.
- Evidence kit. Carry a printed result table, screenshots and a short video of each step.
Plan B. Each live step has an alternative: a recorded clip for the sensor, a saved screenshot for the server, an emulator for the phone.
Cables fall out, Wi-Fi is blocked and batteries go flat; with a plan B the demo continues and the examiner sees professional preparation.
Conclusion. A timed, rehearsed demo with a plan B for every live step turns hardware risk into a controlled presentation.
Q3 (10 marks). Explain the structure of a Project III report and how the results should be presented. Cover objectives, design, hardware, data, mobile app, field test, ethics and viva preparation. Use KhetSense as the example.
Introduction. A project report is the permanent record that the examiner reads before the viva. It must connect each claim to evidence. A sensor and mobile project needs extra evidence for hardware, data quality and field behaviour.
1. Introduction and objectives. A four-part problem statement with numbers ("35 percent of water wasted") and five measurable objectives O1 to O5.
2. Requirements and design. User stories with priorities, the four-layer architecture (Figure 1.1) and the bill of materials; version 1 cost Rs 34,900 and was revised to Rs 26,700 to meet the budget.
3. Hardware and firmware. Circuit photograph, wiring diagram, calibration method and result (0.32 points in the simulation) and battery calculation (165 days for the batch design).
4. Data and analysis. Schema with constraints, cleaning rules and counts, anomaly rules and the forecast with a baseline: 0.58 points against 1.31 for persistence.
5. Mobile app. Wireframes, offline-first architecture, queue and idempotent sync (6 unique actions applied, 5 duplicates ignored), freshness labels and permissions.
6. Field test and results. A 48-hour log reduced to a PASS or FAIL table: four objectives passed and O1 failed with a diagnosed cause and a proposed fix.
7. Ethics. State what is simulated, obtain consent, credit sources and photographs, and respect the Electronic Transactions Act 2063.
8. Viva preparation. Prepare answers on component choice, accuracy, offline behaviour and failures, each with a measured number.
| Chapter | Key evidence |
|---|---|
| Objectives | numbered, measurable targets |
| Hardware | parts table, photo, calibration error |
| Data | cleaning counts, forecast vs baseline |
| App | wireframes, sync test |
| Field test | PASS or FAIL table |
Conclusion. A report that links every chapter to a measured result, admits its limits and shows its failures is both honest and convincing, and it makes the viva an easy discussion of work the student truly understands.