Unit 6 · 10 teaching hours · 27 min read
Software Process Model (SPM)
What the syllabus asks for 8
- Software Project Concept
- Concept of software development process
- Concept of SDLC life cycle
- System Analyst vs Software Engineer
- Requirement Collection Methods
- Concept of system design
- Software and quality
- Software development models: waterfall, prototype, agile
Writing a 50-line program needs no plan. Building the software that prints the NEB result of half a million students, or that runs a bank's mobile app, needs a plan more than it needs clever code: what exactly must it do, who decides that, in what order will the work happen, how will anyone know it is correct, and what happens when the rules change next year. Software engineering is the answer to those questions, and a software process model is a ready-made plan for the order of the work. This unit covers the life cycle, the people, the requirement-gathering methods, design, quality, and the models themselves — which you must be able to draw as well as describe.
Group B favours define SDLC and explain its phases, differentiate system analyst and software engineer, explain any three requirement collection methods. Group C almost always asks you to draw and explain the waterfall, prototype or spiral model, often with "state its advantages and disadvantages and where it is suitable". Practise drawing each diagram from memory in under three minutes.
6.1 Software project concept
Software is the set of programs, associated data and documentation that make a computer do useful work. A software project is a temporary, planned effort with a fixed goal, a budget, a deadline and a team, which produces a software product. "Temporary" is the key word: a project ends, a product lives on.
Every software project is managed along four constraints, and you cannot change one without moving the others:
| Constraint | Question it answers | Typical measure |
|---|---|---|
| Scope | what will the software do? | list of features, requirement document |
| Time | when must it be delivered? | schedule, milestones, Gantt chart |
| Cost | what may it cost? | person-months × salary + hardware + licences |
| Quality | how good must it be? | defect rate, availability, usability targets |
The project manager plans the work (breaking it into tasks), estimates effort in person-months, assigns people, tracks progress against milestones and manages risk — anything that might go wrong: staff leaving, a requirement changing, a vendor being late, an earthquake closing the office.
Problem. A Kathmandu software house wins a contract to build a school management system. The plan is 8 developers for 5 months. The average cost of a developer is Rs 60,000 per month, hardware and licences cost Rs 3,00,000, and the company adds 20 % of the total for management overhead and risk. What is the estimated effort in person-months and the estimated cost?
Solution.
Effort = 8 \times 5 = 40 person-months.
Staff cost = 40 \times 60{,}000 = \text{Rs } 24{,}00{,}000.
Direct cost = 24{,}00{,}000 + 3{,}00{,}000 = \text{Rs } 27{,}00{,}000.
Overhead = 0.20 \times 27{,}00{,}000 = \text{Rs } 5{,}40{,}000.
Total estimated cost = 27{,}00{,}000 + 5{,}40{,}000 = \text{Rs } 32{,}40{,}000.
Note that effort and time are not interchangeable: putting 40 developers on the job does not finish it in one month, because the communication paths between n people grow as n(n-1)/2 — with 40 people that is 780 channels.
6.2 Concept of the software development process
A software development process is the set of activities, together with their order, inputs and outputs, that turns a customer's need into working software that stays working. Four activities appear in every process, whatever its name:
- Specification — find out and write down what the software must do.
- Design and implementation — decide the structure, then build it.
- Validation — check that it does what the customer wanted.
- Evolution (maintenance) — change it as needs change.
A process model (also called a software development life cycle model) is an abstract description of how those activities are arranged in time: all at once in one pass (waterfall), in repeated small passes (incremental, agile), or driven by risk (spiral). Choosing the model is the first management decision of the project.
The process is the activities you perform; the SDLC is the standard list of phases those activities are grouped into; a process model is one particular arrangement of those phases. In the exam, define the one that is asked — marks are lost for answering "waterfall" when the question said "SDLC".
6.3 Concept of the SDLC life cycle
The SDLC is the structured sequence of phases — from the first study of the problem to the retirement of the system — through which an information system passes, each phase producing a defined deliverable that becomes the input of the next.
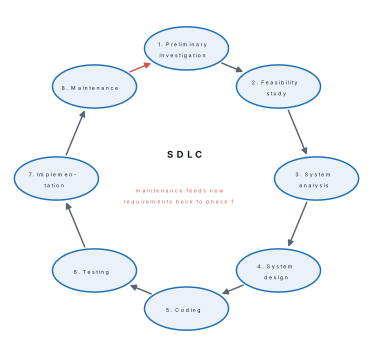
| Phase | What happens | Deliverable |
|---|---|---|
| Preliminary investigation | study the existing system, define the problem and scope | project request / problem statement |
| Feasibility study | is it technically, economically, operationally and legally possible? | feasibility report, cost–benefit analysis |
| System analysis | gather and analyse requirements, model the current and proposed system | SRS, DFDs, ER diagrams |
| System design | decide architecture, database, inputs, outputs, interfaces, algorithms | design document, schema, screen layouts |
| Coding | write and unit-test the programs | source code, unit test results |
| Testing | unit, integration, system and acceptance testing | test report, defect list |
| Implementation | install, convert data, train users, go live | working system, user manual, training |
| Maintenance | fix defects, adapt to change, improve performance | change requests, new versions |
The four kinds of feasibility are worth memorising: technical (do we have the technology and skills?), economic (do the benefits exceed the costs?), operational (will the staff actually use it?) and schedule/legal (can it be done in time, and is it lawful — for example does it obey Nepal's Electronic Transactions Act and privacy rules?).
Maintenance is the longest and most expensive phase — typically 60–70 % of the total cost over a system's lifetime — and comes in four flavours: corrective (fix defects), adaptive (new OS, new tax rate), perfective (new features, faster) and preventive (restructure the code so future change is cheaper).
Please Finish All Design Code Testing Installation Maintenance — Preliminary investigation, Feasibility, Analysis, Design, Coding, Testing, Implementation, Maintenance.
6.4 System analyst vs software engineer
Both work on the same project; they look in opposite directions. The analyst faces the customer and the problem; the engineer faces the machine and the solution.
| Point | System analyst | Software engineer |
|---|---|---|
| Main role | studies the business problem and defines what the system must do | designs, builds and tests the software that does it |
| Works mostly with | users, managers, clients | code, tools, other developers |
| Key output | requirement specification (SRS), DFDs, feasibility report | source code, design documents, test cases, builds |
| Phases involved | investigation, feasibility, analysis, acceptance, training | design, coding, testing, maintenance |
| Core skills | communication, interviewing, business knowledge, modelling | programming, algorithms, data structures, databases, tools |
| Question answered | What should the system do? | How will the system do it? |
| Typical background | management information systems, business + IT | computer science / software engineering |
In a small Nepali software company one person often plays both roles; in a large project they are separate, and the SRS is the contract between them.
6.5 Requirement collection methods
A requirement is a statement of what the system must do (functional — "the system shall print a mark ledger class-wise") or of a quality it must have (non-functional — "results for 500 students shall be generated in under 30 seconds"). Requirements are collected from users by these methods:
| Method | How it works | Strength | Weakness |
|---|---|---|---|
| Interview | structured or unstructured face-to-face questioning of users | deep, allows follow-up questions, body language | slow, costly, needs skill, one user at a time |
| Questionnaire | a fixed set of written questions sent to many users | cheap, reaches many people, easy to summarise | no follow-up, low response rate, poor questions give poor data |
| Observation | the analyst watches the existing work being done | shows what people really do, not what they say | time-consuming; people behave differently when watched |
| Record / document review | reading existing forms, reports, files, manuals, laws | shows the real data items and volumes | documents may be out of date |
| Group discussion (JAD) | users, managers and analysts in one workshop | conflicts resolved on the spot, fast agreement | hard to arrange, a loud person can dominate |
| Prototyping | show a mock screen and let users react to it | users are far better at criticising than at describing | users may think the prototype is the finished product |
| Brainstorming | open idea generation for a new system with no precedent | uncovers ideas nobody asked for | unstructured, needs filtering |
The collected requirements are written into a Software Requirement Specification (SRS): an agreed, numbered, testable document. A good requirement is complete, consistent, unambiguous, verifiable, traceable and feasible. "The system should be fast" fails: it is not verifiable. "A fee receipt shall be printed within 5 seconds of confirmation" passes.
6.6 Concept of system design
Design answers how. It takes the SRS and produces a blueprint detailed enough for a programmer to code from. It is done at two levels:
- Logical (conceptual) design — what the system does, drawn independently of any machine: data flow diagrams, ER diagrams, data dictionary, decision tables.
- Physical design — how it will actually be built: tables and indexes in a particular DBMS, file formats, screen and report layouts, program modules, hardware and network.
The main design activities are architectural design (splitting the system into modules and fixing how they talk), database design (ER model → normalised tables), input design (forms, validation), output design (reports, screens), interface design (usability, navigation) and process design (algorithms). Two properties decide whether a design is good: cohesion (each module does one job — high is good) and coupling (modules depend on each other as little as possible — low is good).
6.6.1 Data flow diagrams
A DFD shows how data moves through a system — never control flow, never timing. Four symbols are used (Yourdon–DeMarco notation):
| Symbol | Meaning | Naming rule |
|---|---|---|
| Circle / bubble | process — transforms data | verb + object, e.g. "Compute result" |
| Rectangle (square) | external entity — source or sink outside the system | noun, e.g. "Student" |
| Open-ended rectangle | data store — a file or table | D1, D2 … plus a noun |
| Arrow | data flow | noun describing the data, e.g. "marks" |
The level-0 DFD (context diagram) shows the whole system as one process with its external entities. It is exploded into a level-1 DFD, which shows the main processes (numbered 1.0, 2.0, …) and the data stores between them. The rule that catches errors is balancing: the flows crossing the boundary of the level-1 diagram must be exactly the flows on the context diagram.
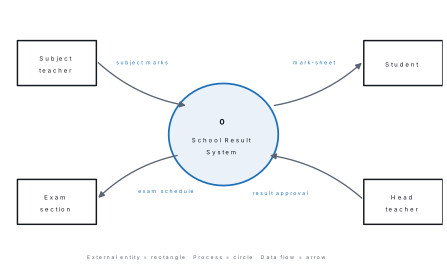
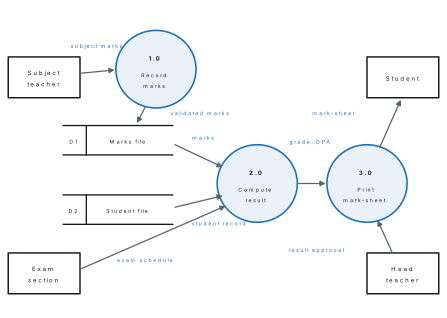
Number every process (0 on the context diagram; 1.0, 2.0 on level 1). Label every arrow with the data, not with a verb. Never draw an arrow from a data store straight to another data store, or from an external entity straight to a data store — data must pass through a process. Never draw a decision diamond: that is a flowchart, not a DFD.
6.6.2 From ER model to tables
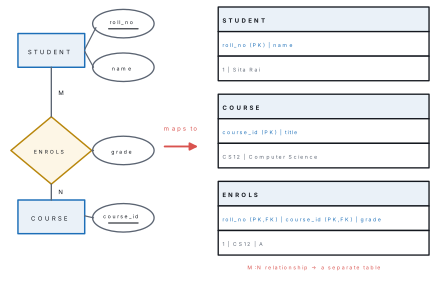
Database design starts with an ER diagram — entities (rectangles), attributes (ellipses, key attribute underlined) and relationships (diamonds) — and converts it into relational tables using three rules: each entity becomes a table with its key as the primary key; a 1:M relationship puts the key of the "one" side into the "many" table as a foreign key; and an M:N relationship becomes a new table whose primary key is the pair of foreign keys.
6.7 Software and quality
Software quality is not "no bugs". It is conformance to the stated requirements, to the explicitly documented development standards, and to the implicit expectations of professional software (Pressman's definition — worth quoting). The international standard ISO/IEC 25010, whose 2023 revision replaced the older ISO 9126, lists nine quality characteristics:
| Characteristic | Question it answers |
|---|---|
| Functional suitability | does it do the required jobs, correctly and completely? |
| Performance efficiency | is it fast enough, and economical with memory and CPU? |
| Compatibility | can it co-exist and exchange data with other systems? |
| Interaction capability (usability) | can users learn it and operate it without errors? |
| Reliability | does it keep working, and recover after failure? |
| Security | is data protected from unauthorised access and change? |
| Maintainability | how cheaply can it be corrected, adapted or improved? |
| Flexibility (portability) | can it be moved, scaled and adapted to new environments? |
| Safety | can it harm people, property or the environment? |
The older McCall factors are still asked for in NEB papers and group the same ideas as product operation (correctness, reliability, efficiency, integrity, usability), product revision (maintainability, flexibility, testability) and product transition (portability, reusability, interoperability).
Quality is built in by two complementary activities: quality assurance (QA), which is process-oriented and preventive — standards, reviews, inspections, audits — and quality control (QC), which is product-oriented and detective — testing the built software. Their companion pair is verification ("are we building the product right?" — reviews, static checks against the design) and validation ("are we building the right product?" — testing against the user's real need).
Two quality measures are easy to examine numerically:
where MTBF is the mean time between failures, MTTR the mean time to repair, E the number of defects found before delivery and D the number found by users after delivery.
Problem. A result-processing server fails on average once every 400 hours of operation and takes 5 hours to repair. During development the team found 92 defects; users reported 8 more in the first year. Compute the availability and the defect removal efficiency.
Solution.
An availability of 98.77 % sounds high, but it is about 4.5 days of downtime a year — unacceptable for a payment system, where "four nines" (99.99 %, under an hour a year) is the target.
The earlier a defect is found, the cheaper it is to remove — this single fact is the economic argument for reviews, for writing a good SRS, and for the iterative models in the next section.
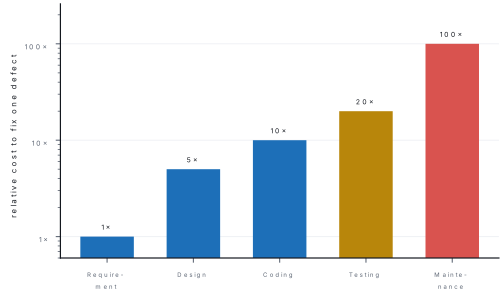
Problem. A team discovers that the fee module ignores the sibling discount. Fixing such an error during the requirement phase costs about Rs 2,000 of effort. Using the relative costs in the figure above, what would the same error cost if it were found (a) during testing and (b) after the system had gone live, and what is the extra cost of the delay in case (b)?
Solution.
(a) Testing is 20\times: 20 \times 2{,}000 = \text{Rs } 40{,}000.
(b) Maintenance is 100\times: 100 \times 2{,}000 = \text{Rs } 2{,}00{,}000.
Extra cost of the delay = 2{,}00{,}000 - 2{,}000 = \text{Rs } 1{,}98{,}000 — and that ignores the cost of wrong bills already sent to parents. One hour of requirement review would have been the cheapest hour in the project.
6.8 Software development models
6.8.1 Waterfall model
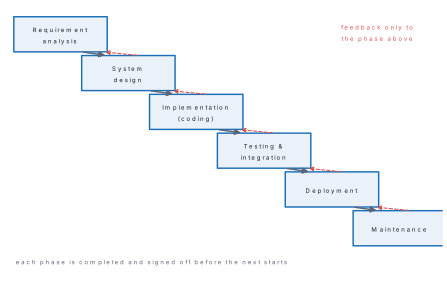
The oldest model (described by Royce in 1970). The phases are executed once, strictly in order, and each must be completed and signed off before the next begins — like water falling from one step to the next, never upwards. The only backward movement is a feedback loop to the phase immediately above when a defect is found.
Advantages. Simple to understand and manage; every phase has a fixed deliverable and review; documentation is complete; easy to estimate cost and schedule; works well when requirements are frozen and well understood.
Disadvantages. Working software appears only very late; going back is expensive; the customer sees nothing until delivery, so a misunderstood requirement is discovered at the worst possible moment; it cannot cope with changing requirements; risk is not addressed explicitly.
Suitable for short, well-understood projects whose requirements cannot change — payroll rewrites, government systems defined by a fixed law, projects with a legal or tender-based specification.
6.8.2 Prototype model
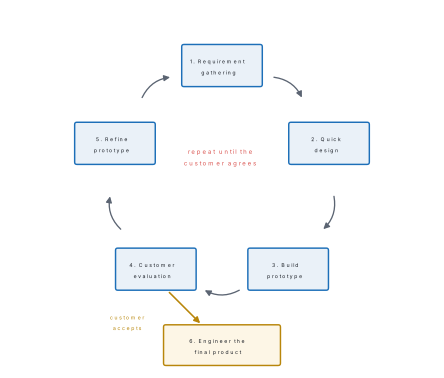
A prototype is a quick, incomplete working model of the system, built to be shown to the user and then refined — or thrown away once the requirements are understood. It exists because users cannot describe what they want in the abstract, but can criticise a screen instantly.
Advantages. Requirements are clarified early; the user is involved throughout; missing functions and misunderstandings surface before real coding; reduces the risk of building the wrong product.
Disadvantages. The customer may demand that the throw-away prototype be shipped; quick-and-dirty choices (wrong language, no error handling) can leak into the product; more customer meetings mean more cost and time; it is hard to know when to stop iterating.
Suitable for systems with unclear or changing requirements and a heavy user interface — a new online service, a first-of-its-kind app.
6.8.3 Incremental and iterative models
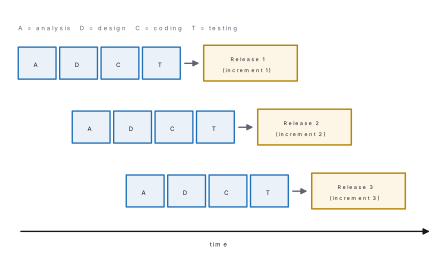
The system is divided into increments; each increment goes through the whole mini life cycle and delivers working software. The first increment is the core product; later increments add features. The customer therefore has something usable after a few weeks instead of a year.
Advantages. Working software early; easier to test and debug a small increment; customer feedback shapes later increments; risk is spread out; money comes in from the first release.
Disadvantages. Needs a good architecture up front or the increments will not fit together; total cost can exceed a single-pass build; planning across increments is harder.
6.8.4 Spiral model
Boehm's spiral model (1988) is the risk-driven model: development proceeds in loops, and each loop is divided into four quadrants. The radius of the spiral represents the cost accumulated so far, and the angle the progress through the current loop. A prototype is built in every loop to attack the biggest remaining risk, and the customer reviews the result before the next loop is funded.
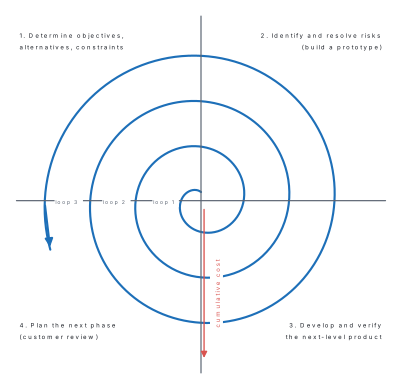
Advantages. Risk is handled explicitly and early; suits very large, costly or novel projects; the customer sees a prototype in every loop; changes can be absorbed in the next loop.
Disadvantages. Expensive; needs genuine risk-assessment expertise, which is rare; no fixed end — a project can spiral forever; over-complicated for small projects.
6.8.5 Agile model
Agile is a family of iterative methods (Scrum, XP, Kanban) built on the Agile Manifesto of 2001, whose four values are: individuals and interactions over processes and tools; working software over comprehensive documentation; customer collaboration over contract negotiation; responding to change over following a plan — while accepting that the items on the right still have value.
Work is delivered in sprints (time-boxes of one to four weeks). In Scrum the product owner keeps a prioritised product backlog; the team pulls the top items into a sprint backlog, holds a 15-minute daily stand-up, and ends the sprint with a review (demo of the shippable increment) and a retrospective (how do we improve?). A scrum master removes obstacles.
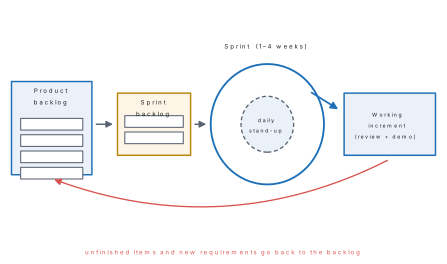
Advantages. Working software every few weeks; welcomes changing requirements, even late; continuous customer involvement; defects found early; high team motivation and communication.
Disadvantages. Little documentation, which hurts long-term maintenance; needs experienced, self-organising teams and an available customer; the final cost and date are hard to fix in advance, so it fits badly with tender-based government contracts.
6.8.6 Comparing the models
| Model | Requirements must be | Cost | Risk handling | Customer involvement | Working software | Best suited to |
|---|---|---|---|---|---|---|
| Waterfall | fixed and fully known | low (if no rework) | poor — risk appears at testing | only at start and end | very late | short projects with a frozen, legal or tender specification |
| Prototype | unclear, UI-heavy | medium — prototypes are extra work | medium — requirement risk reduced | high, continuous | early, but not production-ready | new services where users cannot state requirements |
| Incremental | core known, rest can evolve | medium | medium — spread over increments | after each release | after the first increment | medium/large systems that can be split into features |
| Spiral | may change; project is large | high | best — explicit risk analysis each loop | at every loop review | after a few loops | large, expensive, novel or safety-critical systems |
| Agile | expected to change constantly | medium, hard to fix in advance | good — short feedback loops | very high, daily | every 1–4 weeks | startups, apps, web products with an engaged customer |
Problem. Choose and justify a process model for each: (a) a system for the Department of Transport Management to print smart driving licences, whose rules and forms are fixed by regulation; (b) a mobile app for a Kathmandu startup that delivers groceries, where the founders keep changing their minds about features; (c) the air-traffic control software for Tribhuvan International Airport.
Solution. (a) Waterfall. The requirements come from a written regulation and cannot change during the project; the contract is tender-based, so cost and schedule must be fixed in advance; complete documentation is required for audit.
(b) Agile (Scrum). Requirements change weekly, the customer is in the same city and available daily, and the startup needs a usable app in the market fast; two-week sprints give them a shippable increment every fortnight.
(c) Spiral. The system is large, expensive and safety-critical; a failure costs lives, so each loop must identify and resolve technical risks with prototypes before more money is committed, and each loop ends with a formal customer review.
Problem. A product backlog holds 260 story points of work. The team's measured velocity is 40 story points per three-week sprint. How many sprints and how many weeks are needed, and what happens to the plan if the customer adds 60 more story points after the second sprint?
Solution.
Sprints needed = \dfrac{260}{40} = 6.5 \rightarrow 7 sprints (you cannot do half a sprint).
Time = 7 \times 3 = 21 weeks.
After adding 60 points the backlog is 260 + 60 = 320 points, so 320 / 40 = 8 sprints = 24 weeks. The extra work costs exactly three weeks and, crucially, nothing already built has to be thrown away — in a waterfall project the same change after the design sign-off would have forced rework of the design, code and test documents.
Drawing the waterfall model with long arrows from every phase back to every earlier phase turns it into the iterative model and loses marks. Waterfall allows feedback only to the phase immediately above, and even that is expensive.
Chapter summary
- A software project is a temporary, planned effort constrained by scope, time, cost and quality; effort is measured in person-months and adding people late does not buy time.
- The software development process = specification, design and implementation, validation, evolution. A process model arranges those in time.
- The SDLC phases are preliminary investigation, feasibility study, analysis, design, coding, testing, implementation and maintenance; maintenance takes 60–70 % of lifetime cost and is corrective, adaptive, perfective or preventive.
- The system analyst answers what (SRS, DFDs, talks to users); the software engineer answers how (design, code, tests).
- Requirements are collected by interview, questionnaire, observation, document review, JAD workshops, prototyping and brainstorming, and are written into an SRS that must be unambiguous and verifiable.
- Design is logical (DFD, ER, data dictionary) then physical (tables, screens, modules); aim for high cohesion and low coupling. DFD symbols: circle = process, rectangle = external entity, open rectangle = data store, arrow = data flow. An M:N relationship maps to a separate table.
- Quality = conformance to requirements, standards and implicit expectations; ISO/IEC 25010 (2023) lists nine characteristics. QA is preventive and process-based, QC is detective and product-based. Availability = \text{MTBF}/(\text{MTBF}+\text{MTTR}) and DRE = E/(E+D).
- Models: waterfall (linear, fixed requirements), prototype (unclear requirements), incremental (release by release), spiral (risk-driven loops), agile (sprints, change welcomed).
Practice questions
Group A — Multiple choice (1 mark each)
- Which phase of the SDLC consumes the largest share of the total lifetime cost? [1]aanalysisbcodingctestingdmaintenance
- In a data flow diagram, an open-ended rectangle represents [1]aa processba data storecan external entityda data flow
- The model that is driven by risk analysis in every loop is [1]awaterfallbprototypecspiraldincremental
- The Agile Manifesto was published in [1]a1970b1988c2001d2010
- "Are we building the right product?" is the question asked by [1]averificationbvalidationcdebuggingdcompilation
- A feasibility study that asks whether the staff will accept and use the system is [1]atechnicalbeconomiccoperationaldlegal
Answers to Group A
1. (d) — maintenance is 60–70 % of lifetime cost.
2. (b) — the open-ended rectangle (with a D-number) is a data store.
3. (c) — Boehm's spiral devotes a whole quadrant to identifying and resolving risk.
4. (c) — seventeen practitioners signed it in Utah in 2001.
5. (b) — validation checks against the user's real need; verification checks against the design.
6. (c) — operational feasibility concerns people and working practice.
Group B — Short answer (5 marks each)
- Define SDLC and explain any five of its phases with their deliverables. [5]
- Differentiate between a system analyst and a software engineer on any five points. [5]
- Explain any three requirement collection methods, stating one advantage and one disadvantage of each. [5]
- What is software quality? Explain any four quality characteristics. [5]
- A server has MTBF = 500 hours and MTTR = 4 hours. Compute its availability. The team removed 114 defects before release and users found 6 afterwards; compute the defect removal efficiency. [5]
- Draw a level-0 DFD for a school library issue-and-return system and label all its symbols. [5]
Answers to Group B
1.–4. Use §6.3, §6.4, §6.5 and §6.7; one mark per phase/point/method with its deliverable or advantage.
5. Availability = \frac{500}{500+4}\times 100\% = \frac{500}{504}\times 100\% = 99.21\%. DRE = \frac{114}{114+6}\times100\% = \frac{114}{120}\times100\% = 95\%.
6. One circle labelled "0 — Library system" in the centre. External entities (rectangles): Member, Librarian, Supplier. Flows: Member → "membership details", "book request"; system → Member "issued book slip", "due date"; system → Librarian "overdue list"; Librarian → system "new book details". No data stores are shown on a context diagram — that is the commonest error.
Group C — Long answer (8 marks each)
- Draw and explain the waterfall model. State its advantages, disadvantages and the situations in which it should be used, and compare it with the agile model. [8]
- What is a prototype? Draw the prototype model and explain each step. Compare it with the spiral model on cost, risk and customer involvement. [8]
Answers to Group C
1. Diagram as in §6.8.1 (2 marks — six phases in a descending cascade with one-step feedback), explanation of each phase (2), three advantages (1.5), three disadvantages (1.5), suitability + comparison with agile using the table in §6.8.6 (1).
2. Definition of a prototype (1), diagram of the five-step loop plus the final engineering step (2), explanation of each step (2), advantages and disadvantages (2), comparison with spiral (1): the prototype model reduces requirement risk only and is cheap; the spiral model addresses all technical and management risks, costs much more, and gives the customer a formal review at the end of every loop.
Practise more: Computer Science question bank