Unit 3 · 25 min read
Planning and Decision Making
What the syllabus asks for 7
- Concept and importance of planning
- Types and hierarchy of plans
- The planning process
- Strategic planning
- Quantitative tools for planning
- Decision making
- Problem solving
Planning decides what to do and how; decision making is the act of choosing at every step.
This unit covers the types and hierarchy of plans, the planning process, strategic planning with SWOT, quantitative planning tools (break-even, decision tables and trees, critical path), decision making under certainty, risk and uncertainty, and problem solving.
All the numbers below were recomputed by tools/check_management.py.
- Concept, types, hierarchy and process of planning; importance and limits.
- Management by objectives (MBO); strategic planning; environmental scanning; SWOT.
- Quantitative tools: break-even analysis, decision tables and trees, critical-path scheduling.
- Decision making: approaches, types, certainty / risk / uncertainty criteria.
- Problem solving: types and strategies.
3.1 Concept and importance of planning
Planning is deciding in advance what to do, when, how and who will do it; it bridges where we are and where we want to be. It is the first function: organising, leading and controlling all depend on it.
Importance: gives direction; reduces uncertainty and risk; reduces waste and overlapping; sets standards for control; encourages innovation and foresight; improves coordination.
Limitations: costs time and money; plans can be rigid; the future cannot be predicted exactly; may hinder initiative; internal and external changes make plans obsolete — so plans are reviewed and made flexible.
3.2 Types and hierarchy of plans
| Basis | Types |
|---|---|
| By level / scope | Strategic (top management, long term, whole organisation), tactical (middle, medium term, departments), operational (first-line, short term, daily work) |
| By time | long-range (> 5 years), medium (1–5), short (< 1 year) |
| By use | Standing plans — used repeatedly: policies (broad guides to decisions, e.g. "promote from within"), procedures (step-by-step methods), rules (specific do/don't, no discretion). Single-use plans — programmes, projects, budgets |
| By specificity | specific vs directional |
| By contingency | contingency plans (a "plan B" if assumptions fail) |
The hierarchy of planning
Mission and vision (why we exist; the long-term picture)
   └─ Objectives / goals (what results, by when)
        └─ Strategies (how to use resources to reach objectives)
             └─ Policies (guides to decisions)
                  └─ Procedures (sequences of steps)
                       └─ Rules (specific requirements)
                            └─ Programmes, projects and budgets (the detailed single-use plans)
Each plan serves the one above it, which keeps the organisation consistent from mission to daily work.
3.3 The planning process
- Be aware of the opportunity, through environmental scanning and self-analysis.
- Set objectives, specific and measurable (SMART).
- Develop planning premises — assumptions about the future (forecasts of demand, inflation, exchange rates, technology, policy). Premises must be agreed so that all plans rest on the same assumptions.
- Identify alternatives.
- Evaluate alternatives against objectives, risk, cost and resources.
- Choose the best alternative (decision making).
- Formulate derivative (supporting) plans — budgets, schedules, policies.
- Implement, then monitor and control (which feeds back to step 1).
Management by objectives (MBO)
A participative planning and control technique (Peter Drucker): superiors and subordinates jointly set objectives, define each person's key results, review progress regularly and appraise by results.
Steps set organisational goals → cascade to departments and individuals → agree on action plans → monitor → appraise and reward → reset.
Advantages clarity, commitment, motivation, objective appraisal.
Limitations time-consuming paperwork, emphasis on the measurable and short-term, rigid goals in a changing environment.
3.4 Strategic planning
A strategy is a comprehensive, long-term plan of how the organisation will use its resources to reach its goals and achieve competitive advantage.
Strategic planning has five stages: (1) define mission, vision and objectives; (2) analyse the environment and the organisation; (3) formulate strategies; (4) implement; (5) evaluate and control.
Environmental scanning
Systematically collecting and analysing information about the external environment (economic, social, political, technological, competitors, customers) and internal strengths.
Methods: reading published reports and news; analysing statistics; surveys of customers and suppliers; competitor intelligence; expert opinion and the Delphi method; scenario planning; trend extrapolation; attending trade shows; PEST analysis; Porter's five forces (rivalry, new entrants, substitutes, buyer power, supplier power).
SWOT analysis
| Helpful | Harmful | |
|---|---|---|
| Internal | Strengths — what we do well | Weaknesses — what we lack |
| External | Opportunities — favourable outside trends | Threats — unfavourable outside trends |
Strengths: skilled young developers, low cost. Weaknesses: no brand, limited capital. Opportunities: global demand for outsourcing, government support for ICT. Threats: brain drain, unstable power and internet, foreign competitors.
Strategies by pairing: SO (use strengths to take opportunities: bid for overseas contracts), WO (overcome weaknesses using opportunities: partner with a foreign firm), ST (use strengths against threats: retention bonuses), WT (defend: save capital, avoid risky projects).
Formulating and implementing strategy
Levels: corporate strategy (what business to be in: growth, stability, retrenchment), business strategy (how to compete: cost leadership, differentiation, focus — Porter) and functional strategy.
Implementation requires structure, resources, leadership, culture, policies and a budget; evaluation compares results with objectives. The BCG matrix (stars, cash cows, question marks, dogs) helps decide which businesses to invest in.
3.5 Quantitative tools for planning
Break-even analysis
The break-even point (BEP) is the volume of sales at which revenue equals total cost — no profit, no loss.
BEP (units) = Fixed cost ÷ (Price − Variable cost per unit); BEP (sales value) = BEP units × price = FC ÷ contribution margin ratio; units for target profit = (FC + profit) ÷ contribution per unit.
A shop's fixed costs are Rs 60,000 per month; each item sells for Rs 50 and costs Rs 30 to buy and handle. Contribution per unit = 50 − 30 = Rs 20 (the contribution margin ratio is 20/50 = 40 %).
- BEP = 60,000 ÷ 20 = 3,000 units = Rs 1,50,000 of sales.
- For a profit of Rs 20,000: (60,000 + 20,000) ÷ 20 = 4,000 units.
- At 3,500 units: profit = 3,500 × 20 − 60,000 = Rs 10,000.
- Margin of safety at 4,000 units = (4,000 − 3,000)/4,000 = 25 % (sales can fall 25 % before losses begin). Use: decide prices, volumes and whether to launch a product. Assumes costs and prices are linear and that everything produced is sold.
Decision tables and decision trees
A payoff table lists alternatives (rows), states of nature (columns) and the payoffs; a decision tree shows decisions (squares), chance events (circles), probabilities and payoffs, and is solved from right to left by computing expected values.
A firm can build a big plant or a small plant. Demand is high with probability 0.6 and low with 0.4. Big plant: +Rs 200 lakh if high, −Rs 80 lakh if low. Small plant: +60 lakh if high, +10 lakh if low.
EV(big) = 0.6 × 200 + 0.4 × (−80) = 120 − 32 = Rs 88 lakh. EV(small) = 0.6 × 60 + 0.4 × 10 = 36 + 4 = Rs 40 lakh. Choose the big plant on expected value (a risk-averse owner might still prefer the small plant because it cannot lose).
Critical path method (CPM) and PERT
Projects are drawn as a network of activities with durations; the critical path is the longest path through the network and fixes the project duration. Activities on it have zero slack (delay one and the project is delayed); others have slack.
Activities: A (4 weeks) first; B (6 weeks) and C (5 weeks) both follow A; D (3 weeks) follows both B and C. Paths: A–B–D = 4 + 6 + 3 = 13 weeks; A–C–D = 4 + 5 + 3 = 12 weeks.
The critical path is A–B–D, 13 weeks; activity C has 1 week of slack. PERT handles uncertain durations with three estimates — optimistic a, most likely m, pessimistic b: expected time tₑ = (a + 4m + b)/6, variance ((b − a)/6)².
For activity (2, 4, 6): tₑ = 24/6 = 4; for (3, 5, 13): tₑ = (3 + 20 + 13)/6 = 6.0 and variance (10/6)² = 2.78.
Also used: Gantt charts (bars on a calendar), forecasting (moving averages, regression), linear programming, queuing and inventory models.
Economic order quantity EOQ = √(2DS/H): with annual demand D = 1,200, ordering cost S = Rs 50 and holding cost H = Rs 6 per unit per year, EOQ = √20,000 ≈ 141 units.
3.6 Decision making
Decision making is the process of choosing the best alternative from the available ones to solve a problem or exploit an opportunity. It is a core managerial activity.
Approaches
- Rational (classical) model: define the problem, list all alternatives, evaluate them, pick the optimum. Assumes complete information and a clear goal — rarely true.
- Bounded rationality / administrative (Simon): limited information, time and thinking capacity; managers satisfice — accept the first solution that is good enough.
- Intuitive: experience-based, quick, for familiar situations.
- Political / garbage-can: decisions reflect power and chance as well as analysis.
- Behavioural biases to watch: anchoring, overconfidence, confirmation bias, escalation of commitment (throwing good money after bad), groupthink.
Types of decisions
| Basis | Types |
|---|---|
| Frequency | programmed (routine, rule-based: reorder stock when it falls below 50) vs non-programmed (new, unstructured: enter a new market) |
| Level | strategic, tactical, operational |
| Participants | individual vs group (group: more ideas and acceptance, but slower; risk of groupthink) |
| Importance | major vs minor; routine vs adaptive vs innovative |
| Certainty | certainty, risk, uncertainty |
The decision-making process
- Identify and define the problem (distinguish symptoms from causes).
- Identify decision criteria and their weights.
- Develop alternatives.
- Analyse each alternative (costs, benefits, risks).
- Select the best.
- Implement.
- Follow up and evaluate the results; learn.
Decision making under certainty, risk and uncertainty
- Certainty: outcomes are known. Choose the alternative with the best result (weighted score: 0.5 × 8 + 0.3 × 6 + 0.2 × 9 = 7.6).
- Risk: the outcomes' probabilities are known: use the expected monetary value (EMV).
- Uncertainty: probabilities unknown: use decision criteria that reflect your attitude.
States of nature: S1 (boom), S2 (normal), S3 (slump). Probabilities (for risk): 0.3, 0.5, 0.2.
| Alternative | S1 | S2 | S3 |
|---|---|---|---|
| A: expand | 80 | 50 | −20 |
| B: moderate | 60 | 40 | 10 |
| C: hold | 45 | 40 | 30 |
Under risk (EMV): A = 0.3 × 80 + 0.5 × 50 + 0.2 × (−20) = 24 + 25 − 4 = 45; B = 18 + 20 + 2 = 40; C = 13.5 + 20 + 6 = 39.5 → choose A.
Expected value of perfect information = 0.3 × 80 + 0.5 × 50 + 0.2 × 30 − 45 = 55 − 45 = 10 (the most it is worth paying for a perfect forecast). Under uncertainty (no probabilities):
- Maximax (optimist): best of the best: A 80, B 60, C 45 → A.
- Maximin (Wald, pessimist): best of the worst: A −20, B 10, C 30 → C.
- Laplace (equal likelihood): averages A 36.67, B 36.67, C 38.33 → C.
- Hurwicz with optimism α = 0.7: A = 0.7 × 80 + 0.3 × (−20) = 50; B = 42 + 3 = 45; C = 31.5 + 9 = 40.5 → A.
- Minimax regret (Savage): regret = best payoff in the column − payoff. Column bests 80, 50, 30. Regrets: A (0, 0, 50) max 50; B (20, 10, 20) max 20; C (35, 10, 0) max 35 → choose B (smallest maximum regret). Different attitudes give different answers — which is the point: the criterion expresses the decision maker's attitude to risk.
Group decision techniques
Brainstorming (generate ideas without criticism), nominal group technique (silent writing, then ranked voting), Delphi (anonymous expert rounds), devil's advocate, electronic meetings.
3.7 Problem solving
A problem is a gap between the actual and the desired state. Types: structured (known, routine, clear solution) vs unstructured (novel, ambiguous); crisis, non-crisis and opportunity problems.
Steps: (1) recognise and define the problem (ask "why" five times to reach the root cause); (2) gather facts and analyse causes (cause-and-effect/fishbone diagram, Pareto chart); (3) generate solutions; (4) evaluate and choose; (5) implement; (6) review.
Strategies/techniques: fishbone (Ishikawa) diagram (categories of causes: people, method, machine, material, measurement, environment); 5 Whys; Pareto analysis (about 80 % of effects come from 20 % of causes: if two of ten causes account for 15 of 25 complaints, that is 60 %, so fix those first); brainstorming; trial and error; lateral thinking; algorithmic (step-by-step rules) vs heuristic (rules of thumb); PDCA.


3.1.1 Eight advantages of planning
- It gives the organisation a clear direction. A written plan states where the organisation wants to be and by when, so that every department pulls the same way. A college with a plan to start a BCA programme in two years can recruit teachers, build a lab and apply for affiliation in the right order. Without such a plan, effort is scattered.
- It reduces uncertainty and risk. Planning forces managers to forecast demand, costs and possible problems before they happen. Seeing a risk early, such as a power cut during an online examination, allows a generator to be arranged in advance. The future stays uncertain, but surprises become fewer and smaller.
- It helps in using resources economically. A plan shows how much money, staff and time each activity needs, so none is wasted on low-priority work. A budget for a school picnic or a software project stops spending from running past the funds. This is especially important for small Nepali firms with limited capital.
- It improves coordination. When all departments follow one plan, their work fits together at the right time. In Figure 3.1 the design team finishes before the building team starts, so no one waits or repeats work. Plans also make clear who depends on whom.
- It supports control. A plan contains targets, and targets are the standard against which results are measured. If the plan says 600 units must be sold to break even, a manager can see every month whether the firm is above or below that line. Planning and controlling are therefore inseparable.
- It encourages creative and forward thinking. Writing a plan makes managers ask what could be done better and which new opportunities exist. Using a SWOT matrix (Figure 3.2) often reveals ideas that daily routine hides. It moves the organisation from reacting to leading.
- It improves decision making. A plan fixes goals and criteria, so decisions can be tested against them. A manager who must choose between a large and a small lab can compare the expected values in Figure 3.4. Reasoned choices are easier to explain and defend.
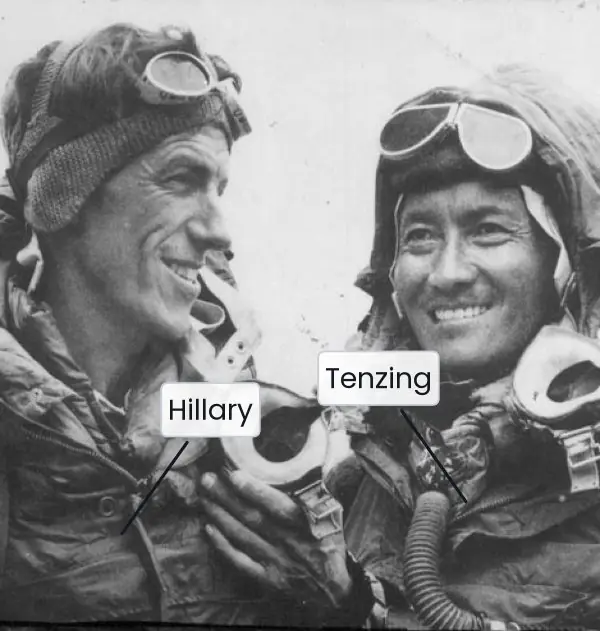
- It motivates employees. People work better when they know the goal and their part in it. Planning with staff involvement, as in management by objectives, increases commitment and pride in results. The first ascent of Everest in 1953 shows how a shared, clear objective can unite a large team.
Formula and fact sheet
- BEP units = FC ÷ (P − VC); target-profit units = (FC + profit) ÷ contribution; margin of safety = (actual − BEP) ÷ actual.
- Critical path = longest path; slack = 0 on it. PERT tₑ = (a + 4m + b)/6.
- EMV = Σ probability × payoff; EVPI = EV with perfect information − best EMV.
- Uncertainty criteria: maximax (optimist), maximin (pessimist), Laplace (average), Hurwicz (α-weighted), minimax regret.
- Plan hierarchy: mission → objectives → strategies → policies → procedures → rules → programmes/budgets.
- SWOT pairs: SO, WO, ST, WT. EOQ = √(2DS/H).
Chapter summary
- Planning gives direction and a basis for control; strategic, tactical and operational plans fit into a hierarchy from mission to rules; the planning process runs from premises to evaluated, controlled implementation.
- MBO makes planning participative; strategic planning uses environmental scanning and SWOT.
- Break-even, decision trees, PERT/CPM and EOQ are practical quantitative tools.
- Decisions are programmed or non-programmed and made under certainty, risk or uncertainty, each with its own criteria; real managers satisfice.
- Problem solving finds root causes with fishbone, 5 Whys and Pareto analysis.
Practice
- Define planning; explain its importance and limitations.
- Explain the types of plans and the hierarchy of plans.
- Describe the planning process and explain MBO.
- What is environmental scanning? Prepare a SWOT of a college computer lab.
- A product sells at Rs 80, variable cost Rs 50, fixed cost Rs 90,000. Find the BEP in units and value, and units for Rs 30,000 profit.
- Solve the decision tree: build (EV) a big shop with 0.5 chance of Rs 300 lakh and 0.5 chance of −Rs 100 lakh versus a small shop with a certain Rs 70 lakh.
- Activities: A 3, B 5 (after A), C 7 (after A), D 2 (after B and C). Find the critical path and the slack of B.
- Apply maximax, maximin and minimax regret to the table of 3.6.
- Differentiate programmed and non-programmed decisions; explain the decision-making process.
- Explain the steps of problem solving with a fishbone example for "late assignments".
Answers and worked solutions
1. Planning = deciding in advance what, how, when and who. Importance: direction, lower risk, standards for control, coordination; limitations: cost, rigidity, uncertain future.
2. Strategic/tactical/operational; standing (policies, procedures, rules) and single-use (programmes, budgets); hierarchy from mission to budgets (3.2).
3. Steps in 3.3; MBO: superiors and subordinates jointly set measurable objectives, review progress and appraise results.
4. Scanning = collecting and analysing external information. SWOT sample: S — modern PCs, qualified instructor; W — limited lab hours; O — industry demand for skills; T — equipment obsolescence, power cuts.
5. Contribution = 80 − 50 = 30. BEP = 90,000/30 = 3,000 units = Rs 2,40,000. For Rs 30,000 profit: (90,000 + 30,000)/30 = 4,000 units.
6. Big: 0.5 × 300 + 0.5 × (−100) = 150 − 50 = Rs 100 lakh; small: Rs 70 lakh certain. Choose big on EV; the small shop is safer.
7. A–B–D = 3 + 5 + 2 = 10; A–C–D = 3 + 7 + 2 = 12. Critical path A–C–D, 12 days; slack of B = 12 − 10 = 2.
8. Maximax → A (80); maximin → C (30); minimax regret → B (max regret 20).
9. Programmed: routine and rule-based; non-programmed: new and unstructured. Process: define the problem → criteria → alternatives → analyse → select → implement → follow up.
10. Define the gap (assignments are late) → analyse causes with a fishbone (People: poor time management; Method: unclear deadlines; Machine: no computers; Material: no references; Environment: noisy hostel) → choose solutions → implement (staged deadlines) → review.
Model answers (5 and 10 marks)
Q1 (5 marks). What is SWOT analysis? Prepare a SWOT matrix for a small software company in Nepal.
Introduction. SWOT analysis is a strategic planning tool that lists an organisation's internal Strengths and Weaknesses and the external Opportunities and Threats, so that managers can choose strategies that fit both the organisation and its environment. Figure 3.2 shows a completed matrix.
- Strengths are internal advantages such as skilled low-cost programmers, good relations with local banks and quick delivery of small projects.
- Weaknesses are internal limits such as small capital, dependence on three large clients and the absence of a formal quality process.
- Opportunities are favourable external trends: the spread of digital payments through ConnectIPS and Fonepay, government e-service projects and the export of IT services.
- Threats are unfavourable external forces: migration of skilled staff, competition from larger foreign vendors and unreliable power and internet.
- Using the matrix. Match strengths to opportunities (offer payment-system software to banks), repair weaknesses that meet threats (a quality process to win bigger contracts) and avoid the combinations where weakness meets threat.
Conclusion. SWOT is simple but powerful when it is honest and specific; its value lies in the strategies it leads to, not in the list itself.
Q2 (5 marks). A firm sells a product at Rs 500 per unit. Variable cost is Rs 300 per unit and fixed cost is Rs 1,20,000. Find the break-even point, the units needed for a profit of Rs 80,000, and the margin of safety at 800 units. Explain the assumptions.
Introduction. Break-even analysis finds the sales volume at which total revenue equals total cost, so there is neither profit nor loss. Figure 3.3 plots the situation.
- Contribution per unit = selling price - variable cost = 500 - 300 = Rs 200.
- Break-even units = fixed cost / contribution = 1,20,000 / 200 = 600 units; break-even sales = 600 x 500 = Rs 3,00,000.
- Units for a target profit of Rs 80,000 = (fixed cost + profit) / contribution = (1,20,000 + 80,000) / 200 = 1,000 units.
- Profit at 800 units = 800 x 200 - 1,20,000 = Rs 40,000; the margin of safety is 800 - 600 = 200 units, which is 200 / 800 = 25 percent of sales: sales can fall by that much before a loss appears.
- Assumptions. Price and variable cost per unit are constant, fixed cost stays fixed over the range, everything produced is sold, and only one product is made.
Conclusion. Break-even analysis tells a manager the minimum volume that must be sold; its limits are the simple, straight-line assumptions, which real costs seldom follow exactly.
Q3 (10 marks). Define planning. Explain the planning process, the types and hierarchy of plans, and the advantages and limitations of planning.
Introduction. Planning is the management function of deciding in advance what is to be done, when, how and by whom, in order to reach chosen goals.
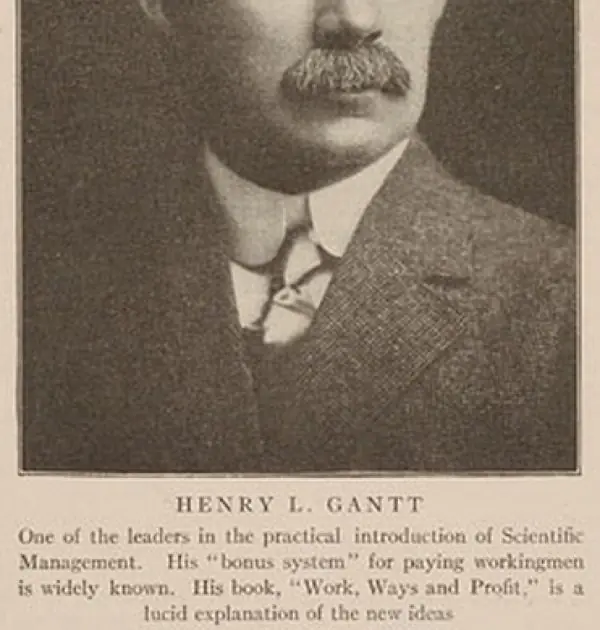
It is the first function in Figure 1.2 because organising, leading and controlling all depend on it. Henry Gantt's chart (Plate 3.1) and the carefully staged Everest expedition of 1953 are two well-known pictures of planning.
The planning process.
- Be aware of opportunities through environmental scanning and SWOT analysis (Figure 3.2).
- Set objectives: specific, measurable, achievable, relevant and time-bound (SMART).
- State planning premises: forecasts and assumptions about the future, such as demand, prices and policy.
- Identify alternatives that could achieve the objectives.
- Evaluate alternatives against the objectives and premises, using tools such as break-even analysis and decision trees (Figures 3.3 and 3.4).
- Select the best alternative and adopt it as the plan.
- Formulate supporting plans, for example hiring, purchasing and training plans.
- Prepare budgets that convert plans into money terms, and then implement and review.
Types of plans. By time: long-term (over five years), medium-term and short-term (up to one year).
By use: single-use plans (programmes, projects and budgets for one occasion) and standing plans (policies, procedures and rules used repeatedly).
By level: strategic plans by top managers, tactical plans by middle managers and operational plans by supervisors.
Hierarchy of plans. Figure 3.1 shows the order: mission, objectives, strategies, policies, procedures and rules, and programmes and budgets. Each lower plan must support the one above it.
Advantages. Planning gives direction, reduces risk, uses resources economically, coordinates departments, supports control, encourages foresight, improves decisions and motivates staff (section 3.1.1).
Limitations. It costs time and money; it depends on forecasts that may be wrong; it can make an organisation rigid; it may be pushed aside by urgent daily problems; and a plan nobody believes in is only paper.
| Basis | Standing plan | Single-use plan |
|---|---|---|
| Use | repeated situations | one occasion |
| Examples | policy, procedure, rule | project, programme, budget |
| Life | long | ends with the project |
Conclusion. Planning does not remove uncertainty, but it prepares an organisation to meet it. Good plans are specific, linked from mission to budget, and reviewed regularly as the environment changes.
Q4 (5 marks). A college can build a large lab (profit Rs 30 lakh if demand is high, loss Rs 6 lakh if low) or a small lab (profit Rs 12 lakh if high, Rs 4 lakh if low). The chance of high demand is 0.6. Use expected monetary value to decide and find the expected value of perfect information.
Introduction. Under risk, probabilities of outcomes are known, so the manager chooses the alternative with the highest expected monetary value (EMV). Figure 3.4 shows the decision tree.
- EMV of the large lab = 0.6 x 30 + 0.4 x (-6) = 18 - 2.4 = Rs 15.6 lakh.
- EMV of the small lab = 0.6 x 12 + 0.4 x 4 = 7.2 + 1.6 = Rs 8.8 lakh.
- Decision: build the large lab, since 15.6 is greater than 8.8.
- With perfect information the college would build the large lab when demand is high (30) and the small lab when it is low (4): 0.6 x 30 + 0.4 x 4 = Rs 19.6 lakh.
- EVPI = 19.6 - 15.6 = Rs 4.0 lakh, the most the college should pay for a perfect demand survey.
Conclusion. The large lab has the higher expected profit, but it also carries the risk of a loss; a risk-averse owner might still choose the small lab.