Unit 6 · 24 min read
Controlling, Quality and the Global Context
What the syllabus asks for 9
- Concept and process of control
- Types of control
- Characteristics of an effective control system
- Control tools and techniques
- Quality
- Total Quality Management (TQM)
- Kaizen, Six Sigma and 5S
- The global context of management
- Management trends and scenario in Nepal
Plans can fail quietly; control is how managers notice and fix it.
This unit covers the control process, its types and tools, quality control and Total Quality Management (TQM), Deming's principles, Kaizen, Six Sigma and 5S, then the global context of management and management trends in Nepal.
- Concept, process, types and characteristics of effective control; control tools (budgets, variance, charts).
- Quality: concept, quality control, TQM, tools, Deming's 14 points and PDCA.
- Kaizen, Six Sigma (DPMO), the Japanese 5S.
- The global context: international business, multinational management, cultural differences.
- Management trends and scenario in Nepal.
6.1 Concept and process of control
Controlling is the function of monitoring performance, comparing it with standards, and taking corrective action so that actual results match plans. It closes the management loop: planning sets standards, control checks them.
Purposes: keep plans on track; detect deviations early; cut waste; coordinate; maintain quality; protect assets; provide data for the next plan.
The control process (four steps)
1. Set standards  →  2. Measure actual performance  →  3. Compare with standards (find deviation)  →  4. Take corrective action
        ▲                                                                                                │
        └──────────────────────────── revise standards if they were unrealistic ◄─────────────────────────┘
- Establish standards — measurable targets derived from the plan: quantity, quality, cost, time (e.g. 98 % uptime, ≤ 3 % defects, project within Rs 5 lakh).
- Measure performance — observation, reports, statistics, audits, sampling; measure at the right frequency and place.
- Compare actual with standard; decide whether the deviation is acceptable (use a tolerance range — management by exception focuses attention only on significant deviations).
- Take corrective action — fix the cause (retrain, repair, re-plan), or revise the standard if it was unrealistic; or do nothing if within tolerance.
Budget for a month: Rs 1,20,000; actual spending: Rs 1,35,000. Variance = 1,35,000 − 1,20,000 = Rs 15,000 adverse, i.e. 15,000/1,20,000 = 12.5 % over budget.
Investigate the cause (overtime? price rise? waste?), then act (control overtime, renegotiate with suppliers) or revise the budget if the cause is permanent.
6.2 Types of control
| Type | When it acts | Aim | Example |
|---|---|---|---|
| Feedforward (preliminary, steering) | before the activity | prevents problems by controlling inputs | screening job applicants, inspecting raw materials, pre-flight checks, design reviews |
| Concurrent (real-time, yes/no) | during the activity | corrects as the work proceeds | supervision, a software test run in CI, automatic temperature control, a bank's real-time fraud alert |
| Feedback (post-action) | after the activity | learns from results to improve next time | final inspection, financial statements, exam results, customer surveys |
Also: strategic, tactical and operational control by level; financial, operational, behavioural and quality controls; bureaucratic (rules, procedures) vs clan (culture and shared values) control; preventive vs corrective.
The best systems use all three timings; feedforward is cheapest, feedback is the most common but acts too late.
6.3 Characteristics of an effective control system
Suitable (fits the activity and level), timely (information when action is still possible), accurate, economical (the benefit exceeds the cost), flexible, understandable, objective, focused on critical points and exceptions, forward-looking, acceptable to people (not seen as spying; participative), action-oriented (points to who must do what), integrated with planning.
Why people resist control: fear of blame, feeling of mistrust, loss of autonomy, goal displacement (gaming the measure), cost. Overcome by participation, clear and reasonable standards, rewarding results, and feedback that helps rather than punishes.
6.4 Control tools and techniques
| Tool | Use |
|---|---|
| Budgets | financial plans and controls: operating (sales, production, cost), cash, capital, flexible (adjust with activity level), zero-based (every item re-justified); compared with actuals (variance) |
| Financial statements and ratios | liquidity (current ratio), profitability (net profit margin, ROI = profit ÷ investment: 30,000 ÷ 2,00,000 = 15 %), leverage, activity (inventory turnover) |
| Break-even analysis | the volume at which revenue covers cost (Unit 3) |
| Audits | financial (external, verifies statements), internal (efficiency and compliance), management/operational (effectiveness) |
| Gantt charts and PERT/CPM | schedule control; the critical path shows where delay hurts (Unit 3) |
| Statistical quality control: control charts | plot samples over time with a centre line and upper/lower control limits (mean ± 3 standard deviations: for mean 50, SD 2 the limits are 44 and 56); a point outside, or a run in one direction, signals an out-of-control process |
| Inventory control | EOQ, ABC analysis (A: few items of high value, tightly controlled; C: many items of low value), just-in-time (JIT), reorder levels |
| MIS and dashboards | key performance indicators (KPIs) in real time; balanced scorecard (financial, customer, internal process, learning and growth) |
| Management by objectives, performance appraisal | control of people's performance |
| Observation, reports, MBWA (management by walking around) | personal control |
6.5 Quality
Quality is the degree to which a product or service meets or exceeds customer expectations — "fitness for use" (Juran), "conformance to requirements" (Crosby).
Dimensions (Garvin): performance, features, reliability, conformance, durability, serviceability, aesthetics, perceived quality. For software: functionality, reliability, usability, efficiency, maintainability, portability.
Importance: customer satisfaction and loyalty, lower cost of defects and rework, competitiveness, reputation, regulatory compliance.
Cost of quality = prevention + appraisal + internal failure + external failure (the last is most expensive).
Quality control and assurance
Quality control (QC) inspects products and fixes defects (reactive — detect); quality assurance (QA) designs processes so that defects do not arise (proactive — prevent); TQM makes quality everybody's responsibility.
Inspection methods: 100 % inspection vs acceptance sampling; statistical process control.
6.6 Total Quality Management (TQM)
TQM is a management philosophy of continuously improving the quality of all processes and products by involving everyone in the organisation, with a focus on the customer.
Principles and components
- Customer focus — the customer defines quality (external and internal customers).
- Total employee involvement and empowerment — teams, quality circles, training.
- Process-centred — improve the process, not blame the person.
- Continuous improvement (Kaizen).
- Leadership commitment from the top.
- Fact-based decision making with data.
- Supplier partnership.
- Integrated system / prevention over detection; benchmarking.
TQM tools — the "seven basic quality tools" (Ishikawa)
Check sheet (collect data), histogram (distribution), Pareto chart (the vital few: if 2 of 10 causes explain 15 of 25 complaints = 60 %, fix them first), cause-and-effect (fishbone) diagram, scatter diagram (relationship between two variables), control chart, flowchart (process map).
Management tools include benchmarking, quality function deployment (QFD), FMEA, brainstorming, affinity diagrams.
Deming's contribution
W. Edwards Deming (who taught the Japanese after WWII; Japan's Deming Prize is named for him) argued that 85 % of problems are caused by the system (management), not by workers. The PDCA (Deming) cycle:
Plan (identify the problem and design a change) → Do (try it on a small scale) → Check (measure the results) → Act (adopt, or adjust and repeat).
Deming's 14 points (summary): 1 create constancy of purpose; 2 adopt the new philosophy; 3 cease dependence on mass inspection; 4 end awarding business on price alone; 5 improve constantly and forever; 6 institute training on the job; 7 institute leadership; 8 drive out fear; 9 break down barriers between departments; 10 eliminate slogans and targets for the workforce; 11 eliminate numerical quotas; 12 remove barriers to pride of workmanship; 13 institute education and self-improvement; 14 put everyone to work on the transformation.
Also the "seven deadly diseases" (lack of constancy of purpose, emphasis on short-term profits, performance appraisal, mobility of management, using visible figures only, excessive medical costs, excessive legal costs).
Other gurus Juran (quality trilogy: planning, control, improvement), Crosby ("zero defects", "quality is free"), Feigenbaum (total quality control), Ishikawa (quality circles).
6.7 Kaizen, Six Sigma and 5S
Kaizen
Japanese for "change for the better": continuous, incremental improvement by everyone, every day, in small steps rather than big innovations.
Features: involvement of all employees, standardisation then improvement, suggestion systems, "Gemba" (go to the place where work is done), elimination of muda (waste: overproduction, waiting, transport, over-processing, inventory, motion, defects).
Used in Toyota's production system and lean management.
Six Sigma
A data-driven methodology (Motorola, 1980s; popularised by GE) to cut defects and variation, aiming at 3.4 defects per million opportunities (DPMO) — about 99.99966 % yield (with the conventional 1.5σ shift).
Process: DMAIC — Define, Measure, Analyse, Improve, Control (for new designs, DMADV). Roles: Champions, Master Black Belts, Black Belts, Green Belts.
DPMO = defects ÷ (units × opportunities per unit) × 1,000,000.
In a batch of 500 forms with 4 error opportunities each, 34 defects were found.
DPMO = 34 ÷ (500 × 4) × 10⁶ = 34/2000 × 10⁶ = 17,000 DPMO (a defect rate of 1.7 %, yield 98.3 %) — far from the six-sigma target of 3.4 DPMO, so a DMAIC project would study the error sources (Pareto), fix them and control the process.
The Japanese 5S practice
A workplace-organisation method with five Japanese words beginning with S:
| 5S | Japanese | Meaning | Example |
|---|---|---|---|
| Sort | Seiri | remove what is unnecessary | clear unused files and tools |
| Set in order | Seiton | a place for everything, everything in its place | labelled shelves, folder structure |
| Shine | Seiso | clean and inspect | clean workspace and equipment daily |
| Standardise | Seiketsu | make the first three a standard | checklists, colour coding |
| Sustain | Shitsuke | make it a habit; discipline and audits | regular 5S audits |
5S reduces waste and search time, improves safety and morale, and is the foundation of Kaizen and lean.
Other modern control and quality ideas
Just-in-time, lean, benchmarking, ISO 9001 quality management certification, ISO/IEC 27001 (security), CMMI for software process maturity, balanced scorecard, and operations and supply-chain management — managing the flow of materials and information from suppliers to customers.
6.8 The global context of management
Globalisation — the growing interconnection of economies through trade, investment, technology and people. Drivers: trade liberalisation (WTO), falling transport and communication costs, the internet, multinational corporations, regional blocs (SAARC, BIMSTEC, the EU).
Forms of international business: exporting/importing, licensing and franchising, joint ventures and strategic alliances, wholly owned subsidiaries, outsourcing and offshoring. A multinational corporation (MNC) operates in several countries.
Managing across cultures: Hofstede's dimensions — power distance, individualism vs collectivism, masculinity vs femininity, uncertainty avoidance, long-term orientation (Nepal scores high on power distance and collectivism).
Others: high- vs low-context communication (Hall). Managers need cultural intelligence: language, etiquette, holidays, negotiation style, religion, and legal differences.
Opportunities: larger markets, cheaper inputs, access to talent, economies of scale, knowledge transfer.
Challenges: cultural and language differences, exchange-rate and political risk, different laws and ethics, competition, supply-chain disruption, dependence (Nepal's reliance on trade routes through India), brain drain.
Management in a global age: think globally, act locally; diverse and virtual teams; ethics and sustainability (ESG); digital collaboration; resilience.
6.9 Management trends and scenario in Nepal
- Structure: a mix of public enterprises, a large private sector dominated by small and family-owned businesses, a growing cooperative and NGO sector, and foreign-investment firms. Many family firms are shifting towards professional management and governance.
- Management practice: strong hierarchy and personal relationships; reliance on intuition and informal networks; limited use of formal planning and MIS in small firms but rising in banks, telecom, insurance and IT firms; formal training in management through BBS, BBA, MBA and BCA programmes.
- Sectors driving change: banking and financial services (Nepal Rastra Bank regulations, digital payments — eSewa, Khalti, IME Pay, mobile banking), telecom, hydropower, tourism and hospitality, ICT/IT outsourcing, agriculture modernisation, education, remittance-linked businesses.
- Trends: digitisation and e-governance; start-ups and entrepreneurship (incubators, venture funds); corporate social responsibility and sustainability (including post-earthquake reconstruction and disaster resilience); stress on quality (ISO, NS standards); women and youth entrepreneurship; federalism creating new local government administration and procurement needs; growing consumer awareness and consumer-protection law.
- Challenges: political instability and policy changes, weak infrastructure and energy, bureaucratic delay and corruption, brain drain and shortage of skilled managers, small domestic market and trade deficit, informal economy, weak enforcement of contracts, financial-sector risks, and vulnerability to disasters.
- What it demands of managers: ethical leadership, adaptability, professional training of staff, use of technology, community and environmental responsibility, and the ability to compete regionally and globally.


6.6.1 Eight benefits of Total Quality Management
- It improves customer satisfaction. TQM begins with the customer's needs and measures quality as the customer sees it. A bank that cuts the waiting time at the counter and corrects errors in statements keeps its depositors. Satisfied customers return and recommend the organisation to others.
- It reduces defects and rework. By finding causes with tools such as the fishbone and Pareto chart (Figures 6.4 and 6.5), teams remove the source of the error rather than correcting each mistake. Fewer errors mean less rework and fewer complaints. The saving appears directly in lower costs.
- It lowers costs. Preventing defects is cheaper than inspecting and repairing them after the event. Waste in time, material and effort falls when processes are improved step by step. Many firms find that better quality and lower cost go together.
- It involves every employee. TQM asks everyone, from the clerk to the managing director, to take responsibility for quality. Quality circles and suggestion schemes give staff a voice. This raises morale and the sense of ownership.
- It creates a culture of continuous improvement. The PDCA cycle (Figure 6.3) and kaizen make small improvements a daily habit instead of an occasional project. Small gains accumulate into large ones over the years. This is how Toyota became a world leader.
- It improves decisions through data. TQM uses facts, charts and measurement, as the control chart in Figure 6.2 does, instead of opinions. Managers can then tell a real problem from ordinary variation and avoid reacting to every small change. Decisions become easier to defend.
- It strengthens supplier and partner relationships. Quality of output depends on quality of inputs, so TQM builds long-term cooperation with suppliers. A hotel that works with a reliable vegetable supplier gets consistent quality. Shared standards reduce disputes and delays.
- It gives a competitive advantage in global markets. Quality standards such as ISO 9001 and Six Sigma are recognised worldwide, so firms that meet them find it easier to export and to win contracts. For Nepali producers of carpets, tea and software services, quality is a main route to foreign buyers. Quality therefore supports national as well as company growth.
Formula and fact sheet
- Control process: set standards → measure → compare → correct. Types: feedforward (before), concurrent (during), feedback (after).
- Variance = actual − budget; control limits = mean ± 3σ; ROI = profit ÷ investment.
- Pareto: vital few causes; fishbone; 7 QC tools; PDCA; Deming's 14 points; Juran/Crosby.
- Kaizen = continuous small improvement; 5S = sort, set in order, shine, standardise, sustain.
- Six Sigma: DMAIC; 3.4 DPMO; DPMO = defects ÷ (units × opportunities) × 10⁶.
Chapter summary
- Control compares performance with standards and corrects deviations; feedforward, concurrent and feedback controls act before, during and after the work; effective control is timely, economical, flexible and accepted.
- Tools include budgets and variance, ratios, audits, Gantt/PERT, control charts and inventory control.
- Quality is meeting customer needs; TQM involves everyone in continuous improvement using the seven basic tools, Deming's PDCA and 14 points, Kaizen, Six Sigma and 5S.
- Globalisation brings opportunities and challenges that demand cultural intelligence.
- Nepal's management scene is shifting from family-run, relationship-based practice to more professional, digital and quality-conscious management, against infrastructure, political and skill-shortage challenges.
Practice
- Define controlling and explain its steps with a diagram.
- Differentiate feedforward, concurrent and feedback control with examples.
- List and explain the characteristics of an effective control system.
- A project budget is Rs 8,00,000; actual cost is Rs 9,20,000. Compute the variance and percentage and suggest actions.
- A control chart has mean 50 and σ = 2. Find the 3σ limits. Would a sample at 57 be out of control?
- Explain TQM, its principles and the seven basic quality tools.
- Explain Deming's PDCA cycle and any six of his 14 points.
- What are Kaizen, Six Sigma and 5S? Compute DPMO for 25 defects in 1,000 units with 5 opportunities each.
- Explain the challenges and opportunities of globalisation for a Nepali firm.
- Describe the present management scenario and key trends in Nepal.
Answers and worked solutions
1. Controlling = measuring performance against standards and correcting deviations: set standards → measure → compare → take corrective action, with feedback to planning (diagram in 6.1).
2. Feedforward — before: checking inputs (screening applicants); concurrent — during: supervision, automated monitoring; feedback — after: audit, results analysis.
3. Suitable, timely, accurate, economical, flexible, understandable, objective, focused on critical points, forward-looking, acceptable, action-oriented, integrated with planning.
4. Variance = 9,20,000 − 8,00,000 = Rs 1,20,000 adverse, 1,20,000/8,00,000 = 15 % over budget. Investigate (scope creep, price rises, rework); control spending, renegotiate, or re-baseline the budget if the cause is permanent.
5. 50 ± 3 × 2 = 44 to 56; 57 is above 56, so the process is out of control — investigate special causes.
6. TQM: continuous improvement by everyone with customer focus; principles: customer focus, involvement, process orientation, continuous improvement, leadership, fact-based decisions, supplier partnership; tools: check sheet, histogram, Pareto, fishbone, scatter diagram, control chart, flowchart.
7. PDCA: plan, do, check, act. Six points: constancy of purpose, cease dependence on inspection, improve constantly, institute training, drive out fear, break down barriers between departments.
8. Kaizen: continuous incremental improvement; Six Sigma: DMAIC, 3.4 DPMO; 5S: sort, set in order, shine, standardise, sustain. DPMO = 25 ÷ (1,000 × 5) × 10⁶ = 5,000 DPMO.
9. Opportunities: new markets, cheaper inputs, outsourcing contracts, technology transfer. Challenges: cultural differences, exchange-rate and political risk, strong foreign competitors, brain drain, dependence on neighbours' trade routes.
10. A mix of family-run private firms, public enterprises, cooperatives and NGOs; hierarchical, relationship-based practice shifting towards professional management; trends in digital payments, start-ups, ISO quality, CSR and federalism; challenges of instability, infrastructure, corruption and skill shortages.
Model answers (5 and 10 marks)
Q1 (5 marks). Explain the four steps of the control process. A department budgeted Rs 5,00,000 and spent Rs 5,60,000: find and interpret the variance.
Introduction. Controlling is the function of ensuring that actual performance matches plans and of correcting deviations. Figure 6.1 shows its four steps.
- Set standards. Standards are measurable targets taken from the plan: budget, quality level, time limit or sales target.
- Measure performance. Actual results are collected by reports, observation, sampling and information systems.
- Compare with the standard. The deviation is calculated and tested for significance; small deviations are tolerated.
- Take corrective action. The cause is found and fixed, or the standard is revised if it was unrealistic.
Numerical example. Variance = actual - budget = 5,60,000 - 5,00,000 = Rs 60,000, which is 60,000 / 5,00,000 = 12 percent over budget (an adverse variance).
The manager should find the cause (price rise, waste or extra work), correct it, and report to the top. A 2 percent variance might be ignored under management by exception, but 12 percent needs action.
Conclusion. Control closes the management cycle by feeding the findings back to planning.
Q2 (5 marks). What is Total Quality Management? Explain its principles and Deming's contribution.
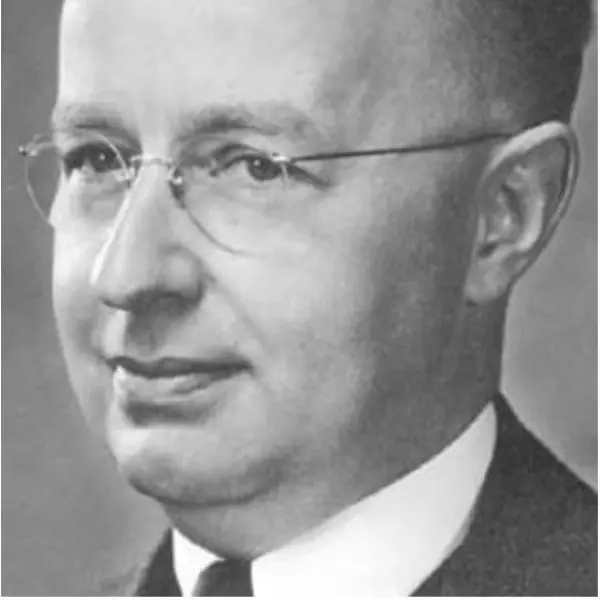
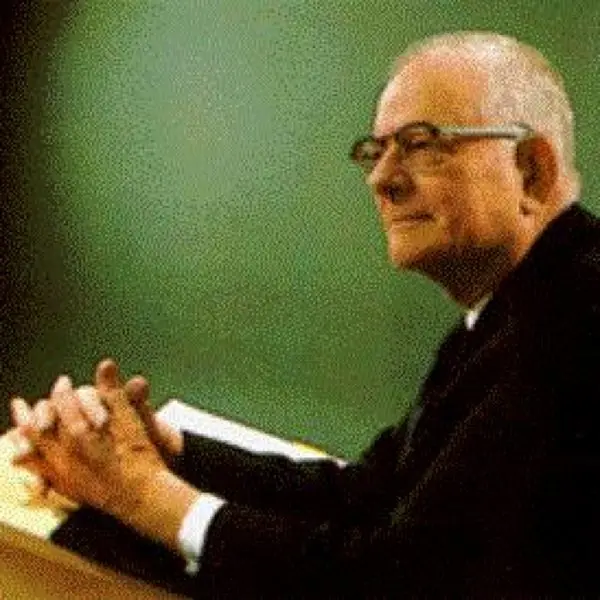
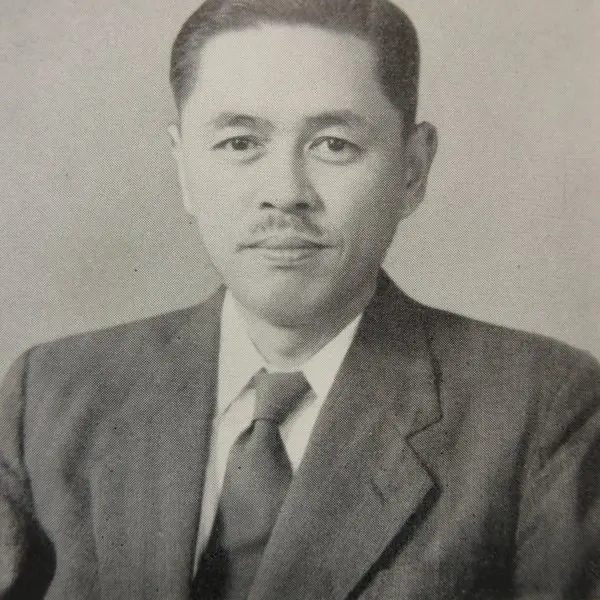
Introduction. TQM is an organisation-wide approach in which every person and process is committed to meeting customer needs through continuous improvement. Its roots lie in Shewhart, Deming and Ohno (Plate 6.1).
- Customer focus. Quality is defined by the customer, not by the producer.
- Total employee involvement. Everyone is responsible for quality, through teams and quality circles.
- Process centred. Work is seen as a chain of processes to be improved, since most defects arise from the system.
- Continuous improvement. The PDCA cycle (Figure 6.3) keeps raising standards.
- Decisions based on facts. Charts and statistics (Figures 6.2, 6.4 and 6.5) replace guesswork.
- Leadership and supplier partnership. Top management must lead, and suppliers are treated as partners.
Deming. He insisted that management, not workers, is responsible for most quality problems, urged an end to dependence on inspection, promoted statistical control and the PDCA cycle, and set out fourteen points that include building constant purpose, driving out fear and removing numerical quotas.
Conclusion. TQM treats quality as a way of managing everything, not as a department.
Q3 (10 marks). Define control. Explain the control process, the types of control, the characteristics of an effective control system and the common control techniques.
Introduction. Control is the management function of setting standards, measuring performance, comparing results and correcting deviations so that organisational goals are achieved.
It is the last function in the cycle of Figure 1.2 but it depends on planning because without goals there is nothing to control against.
The process. Four steps, as shown in Figure 6.1: set standards, measure performance, compare, take corrective action.
A control chart (Figure 6.2) is a good example: the target is the standard, the points are the measurements, and a point outside the limits triggers action.
Types by timing. Feedforward control acts before the activity (checking inputs, preventive maintenance, selection tests). Concurrent control acts during the activity (supervision, live monitoring).
Feedback control acts afterwards (financial statements, audits, examination results). Feedforward is the most effective but needs good forecasts; feedback is the commonest but acts after the damage.
Characteristics of an effective control system. It should be accurate, timely, economical, understandable, flexible, focused on critical points, related to the plan and the structure, acceptable to people, and should point to corrective action.
Management by exception means that managers look only at significant deviations.
Techniques.
- Budgetary control: comparing actual and budgeted income and expenditure; variance analysis.
- Ratio analysis: liquidity, profitability and efficiency ratios of financial statements.
- Break-even analysis: the volume needed to cover costs (Figure 3.3).
- Statistical quality control: control charts and sampling inspection.
- Management audit and internal audit: independent review of performance and compliance.
- PERT and CPM: network control of project time and cost.
- Management information systems: timely and accurate reports.
- Pareto and fishbone analysis: finding the vital causes of a problem (Figures 6.4 and 6.5).
| Basis | Feedforward | Concurrent | Feedback |
|---|---|---|---|
| Time | before | during | after |
| Aim | prevent problems | correct on the spot | learn for the future |
| Example | check lab computers before the exam | invigilation | result analysis |
| Weakness | needs good forecasts | needs supervision time | too late for the present case |
Problems of control. Resistance by employees who feel watched, too much emphasis on what is easy to measure, high cost, and the danger of encouraging people to meet the number instead of the goal.
Conclusion. An effective control system is timely, focused on critical points and accepted by the people it measures. It turns plans into results by making sure that deviations are detected and corrected, and it feeds experience into the next round of planning.
Q4 (5 marks). Explain Kaizen, Six Sigma and 5S. A process made 12 defects in 4,000 units, each with 5 opportunities for defect; find the DPMO.
Introduction. These are three modern quality practices that grew from Japanese and American industrial experience.
- Kaizen means "change for the better": continuous, small improvements made by everyone, using the PDCA cycle (Figure 6.3). It costs little and builds a habit.
- Six Sigma is a data-driven programme (Motorola, 1986) that aims at no more than 3.4 defects per million opportunities. Its improvement method is DMAIC: define, measure, analyse, improve, control.
- 5S is a workplace routine: sort, set in order, shine, standardise, sustain.
- DPMO = defects / (units x opportunities per unit) x 1,000,000 = 12 / (4,000 x 5) x 1,000,000 = 12 / 20,000 x 1,000,000 = 600 DPMO. This is far above the Six Sigma level of 3.4, so more improvement is needed.
- Difference. Kaizen is a continuous, people-based philosophy; Six Sigma is a project-based statistical method; 5S is a housekeeping routine that supports both.
Conclusion. Together they give a workable route to better quality at low cost, even for a small Nepali firm.