Unit 2 · 4 teaching hours · 27 min read
User Interaction Design and UX Research
What the syllabus asks for 7
- The UX design process
- Mind maps
- UX research
- User personas
- User journey maps
- Ideation techniques
- Seeing the ideas: the process, mind map, sample sizes, persona, journey map and Crazy 8s
Design starts with people, not pixels. This unit follows the UX design process from understanding users — interviews, surveys, competitor analysis, personas, journey maps — through ideation with mood boards, brainstorming and sketching.
- The UX design process and user-centred design (UCD).
- Mind maps as a planning tool.
- Conducting user research: interviews, surveys, competitive analysis.
- Creating personas and user journey maps.
- Ideation: mood boards, brainstorming, sketching.
2.1 The UX design process
There is no single standard, but most models follow the same loop. A common five-stage version (the Stanford d.school "design thinking" model):
- Empathise — learn about users through research.
- Define — state the problem (a "how might we…" question) and the requirements.
- Ideate — generate many possible solutions.
- Prototype — build quick, cheap versions.
- Test — try them with users, learn, and return to any earlier stage.
Another view is the double diamond: discover (diverge on the problem) → define (converge) → develop (diverge on solutions) → deliver (converge).
User-centred design (UCD)
ISO 9241-210 describes UCD as an iterative process in which users are involved at every stage.
Its steps: specify the context of use → specify user requirements → produce design solutions → evaluate against requirements, repeating until the design meets them.
Principles: base design on an explicit understanding of users, tasks and environments; involve users throughout; drive the design by user-centred evaluation; iterate; address the whole user experience; use multidisciplinary skills.
A college wants students to apply for exam forms on a phone. Poor brief: "build an exam-form app". UCD brief: "Students in remote areas, often on slow data, need to submit exam forms before the deadline without travelling to the college. How might we let them complete and pay for the form in under five minutes on a low-end phone?" — it names the user, context, constraint and a measurable goal.
2.2 Mind maps
A mind map is a diagram that puts a central idea in the middle and radiates branches of related topics, sub-topics and keywords.
In UX it is used early to explore the problem space, list features and content, group ideas, and plan research questions or a site's structure.
How to make one: write the central topic (e.g. "Online exam form"); draw main branches for the big themes (users, tasks, payment, notifications, risks); add sub-branches; use colours and short keywords; look for clusters and gaps.
Mind maps are fast and non-linear; later they are refined into a sitemap or user-flow diagram.
2.3 UX research
Research replaces guessing with evidence. Two orthogonal distinctions:
| Qualitative | Quantitative | |
|---|---|---|
| Answers | why and how | how many and how much |
| Data | words, observations, behaviour | numbers |
| Methods | interviews, field observation, diary studies, usability tests (small n) | surveys, analytics, A/B tests, click-tracking |
| Sample | 5–12 people | hundreds or thousands |
And attitudinal (what people say) versus behavioural (what people do): both are needed because they differ.
User interviews
One-to-one conversations (20–60 minutes) to learn goals, context, pain points and vocabulary.
Good practice:
- Prepare a discussion guide of open questions; stay flexible.
- Ask open-ended questions ("Tell me about the last time you applied for…") not leading ones ("Don't you find the form confusing?").
- Ask about past behaviour not hypotheticals ("Would you use…?" produces polite lies).
- Use the "five whys" to dig for causes; stay silent and let people fill the pause.
- Get consent, record (with permission), keep notes, and thank participants.
- Recruit people who match the target users, not friends.
After interviews, make an affinity diagram: write each observation on a note, group similar ones, name the groups — the themes become insights.
Surveys
Questionnaires reach many people cheaply. Types of question: multiple choice, rating scales (Likert: strongly disagree … strongly agree), ranking, and a few open text boxes.
Rules: keep it short; one idea per question (no double-barrelled "Is the app fast and easy?"); neutral wording; offer "not applicable"; pilot-test; define the target group and sample size.
Surveys show what and how many, but not why, so pair them with interviews.
Competitive analysis
Study similar products to learn what the market does well and where it fails.
Steps list direct competitors (same product) and indirect competitors (different product, same need); define criteria (features, flows, content, pricing, platforms, usability problems); build a comparison matrix; record screenshots; draw conclusions — opportunities (gaps) and conventions (patterns users already expect).
A heuristic review (Unit 7) of competitors is common.
| Criterion | Competitor A | Competitor B | Our idea |
|---|---|---|---|
| Works offline | No | Partly | Yes |
| Nepali language | No | Yes | Yes |
| Payment methods | Card only | eSewa | eSewa, Khalti, bank |
Other methods
Field observation (watch users in context), contextual inquiry, diary studies, card sorting (for IA), analytics review, stakeholder interviews, and usability testing of the existing product.
2.4 User personas
A persona is a fictional but research-based character who represents a group of real users. It keeps the team's decisions anchored to someone specific ("Would Sita use this?") instead of "the user", who is usually the designer in disguise.
A persona contains: name and photo, demographics (age, occupation, location), goals (what she wants), needs, frustrations/pain points, behaviours (devices, habits, tech skill), context (where and when she uses the product), and a short quote or bio.
Sita Gurung, 20, BCA student, Pokhara. Uses a 4 GB Android phone on mobile data; shares a laptop with her brother.
Goals submit the exam form on time without a trip to college.
Frustrations the portal times out; forms lose data; forms are only in English.
Behaviour checks WhatsApp hourly; trusts eSewa.
Quote "I just want to know my form went through." Design implications: save progress, light pages, Nepali labels, eSewa payment, instant confirmation by SMS.
Personas must come from research data, not imagination; limit them (3–5, with one primary persona); and update them. A proto-persona (assumption-based) is acceptable only as a starting point to be validated.
Related tools: scenarios (a short story of a persona achieving a goal) and empathy maps (says / thinks / does / feels).
2.5 User journey maps
A user journey map visualises the steps a persona takes to achieve a goal across time and touchpoints, along with what they do, think and feel.
Typical layout — columns are stages, rows are layers:
| Awareness | Application | Payment | Confirmation | |
|---|---|---|---|---|
| Actions | hears of the deadline | opens portal, fills form | pays via eSewa | waits for confirmation |
| Touchpoints | notice board, WhatsApp | website | eSewa app | SMS, email |
| Thoughts | "Is it really online?" | "Will my data be lost?" | "Is this safe?" | "Did it work?" |
| Emotions | curious (+) | frustrated by timeout (−−) | anxious (−) | uncertain (−) |
| Pain points | notice is unclear | session timeouts | no payment receipt | no confirmation |
| Opportunities | SMS reminder | autosave | show receipt | instant confirmation |
Steps to build one: choose the persona and scenario; list the stages; fill in actions, touchpoints, thoughts and emotions from research; draw the emotion curve; mark moments of truth (high-stakes points); extract opportunities.
It makes pain points visible to the whole team — the lowest points of the curve are where to redesign first. A service blueprint adds the back-stage processes behind each step.
2.6 Ideation techniques
After research and definition, ideate — produce many ideas before judging any.
Mood boards
A collage of images, colours, textures, typefaces, photos, quotes and logos that captures the look, feel and emotion a design should have (e.g. "calm, trustworthy, youthful").
Used to align the team and client on visual direction before any design work; made on paper, Pinterest or Figma/Miro. A mood board is inspiration, not a design — it leads to a style guide.
Brainstorming
A group session to generate ideas fast. Rules: defer judgement; go for quantity; welcome wild ideas; build on others' ideas ("yes, and…"); stay focused on the question; one conversation at a time.
Variants: brainwriting (silent writing first, avoids dominant voices), Crazy 8s (fold paper into 8 panels; sketch 8 ideas in 8 minutes), worst possible idea, SCAMPER (substitute, combine, adapt, modify, put to another use, eliminate, reverse).
Afterwards cluster and vote (dot voting), then pick ideas to prototype.
Sketching
Fast, rough drawings of screens and flows with pencil and paper. Low cost, no one is afraid to throw them away, and everyone can sketch. Boxes for images, squiggles for text, arrows for flow.
Variants: thumbnail sketches (tiny, many), storyboards (a comic strip of a user's scenario), paper prototypes (cut-outs tested with users). Sketching is where wireframing begins (Unit 6).
2.7 Seeing the ideas: the process, mind map, sample sizes, persona, journey map and Crazy 8s
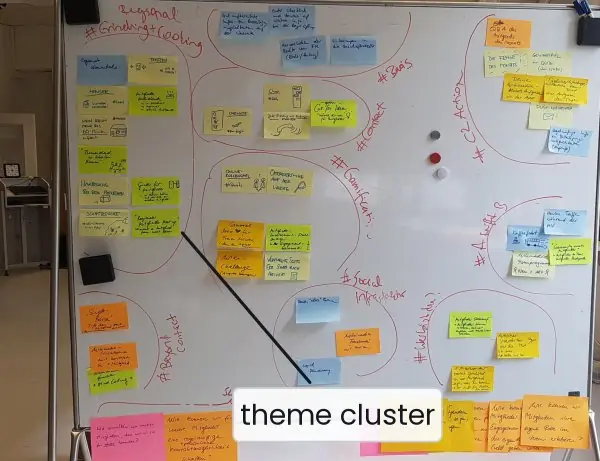
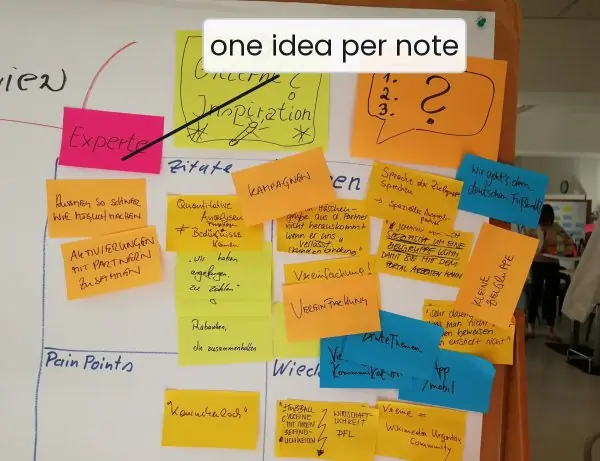
Research and ideation are hands-on work, so this section shows the real artefacts. Plate 2.1 shows the walls of sticky notes where interview findings are grouped.
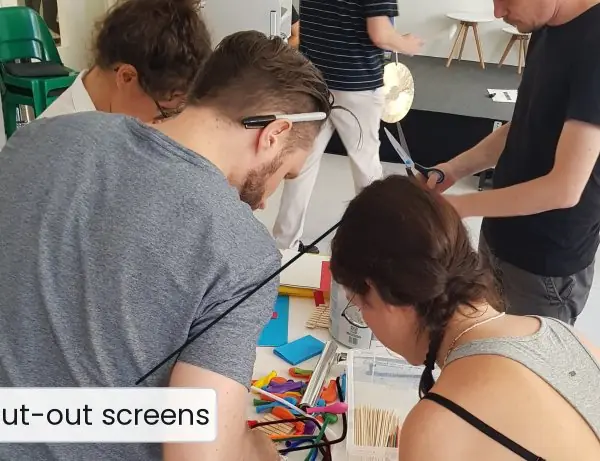
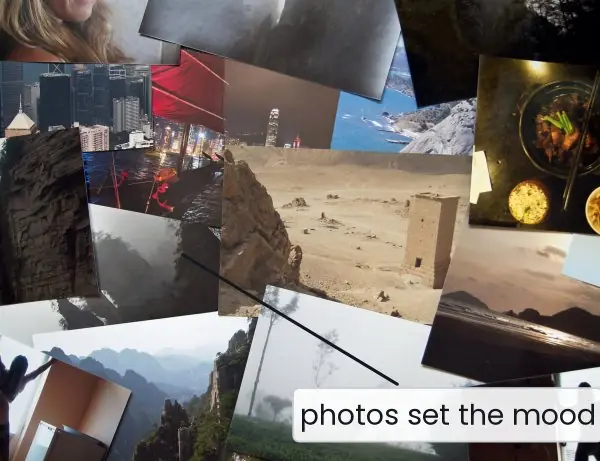
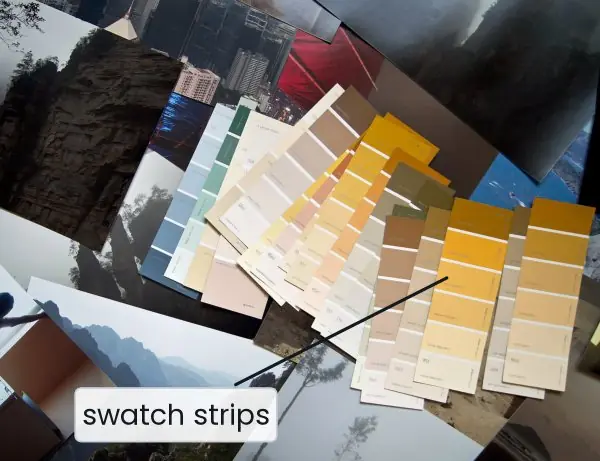
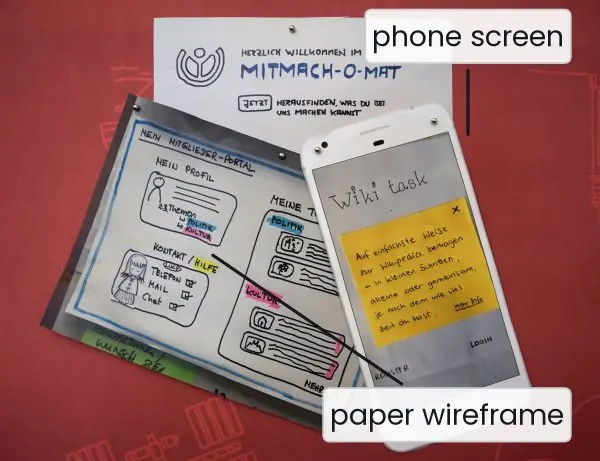
Plate 2.2 shows a mood board, a colour-swatch board and a paper prototype next to the phone screen it became.
The figures then draw the design process, a mind map, the sample-size rule, a persona, a journey map and a Crazy 8s sheet with dot voting.


2.7.1 Eight benefits of UX research and structured ideation in Nepal
- Real needs instead of guesses. Interviews and observation show what users actually do, not what the team imagines. A college that talks to ten students about exam forms will find problems such as slow mobile data or lost sessions that no one in the office noticed. This evidence replaces opinion in design meetings.
- Fewer expensive mistakes. Finding a problem on a paper sketch costs minutes; finding it after launch costs months of developer time. Government portals such as the Nagarik App or the Tribhuvan University exam portal are used by thousands on the same day, so one late fix is very costly. Cheap early tests protect the budget.
- Designs for the users of Nepal, not of Silicon Valley. Research reveals low-end phones, patchy 4G, Nepali (Devanagari) reading habits, and trust in eSewa, Khalti or Fonepay. These facts change the design: light pages, Nepali labels, offline-friendly forms. A foreign template would miss all of them.
- A shared picture inside the team. A persona such as Sita, or a journey map on the wall, gives developers, designers and managers one person to think about. The question "Would Sita understand this?" ends many arguments quickly. Everyone argues about the user and not about taste.
- Pain points become visible and ranked. The emotion curve of a journey map (Fig. 2.5) shows which stage hurts most. A bank can see that account opening is easy but the first transfer is frightening, and fix that first. Effort goes where users suffer most.
- More and better ideas. Brainstorming, brainwriting and Crazy 8s (Fig. 2.6) produce many options before anyone judges. Quiet team members get a voice, and dot voting picks winners fairly. The final idea is usually a combination that no one would have proposed alone.
- Faster agreement with clients and teachers. A mood board (Plate 2.2) lets a client point at the feeling they want, such as calm or youthful, before any screen exists. This avoids late changes of colour and style. For a student project, it also gives clear evidence for the viva.
- Smaller, cheaper samples that still work. Fig. 2.3 shows that five to twelve users reveal most usability problems, so a small team in a college can run a real study in a week. A short survey then confirms how common each problem is. Good research does not need a large budget; it needs a plan.
Formula and fact sheet
- Process: empathise → define → ideate → prototype → test (iterate). UCD: context → requirements → solutions → evaluation.
- Qualitative = why/how (5–12 users); quantitative = how many (surveys, analytics).
- Interview: open, non-leading questions about past behaviour; affinity diagram to find themes.
- Persona = goals, needs, frustrations, behaviours, context; from data, 3–5 of them.
- Journey map = stages × (actions, touchpoints, thoughts, emotions, pain points, opportunities).
- Ideation: mood board (feel), brainstorming (quantity, defer judgement), sketching (fast, low fidelity).
Chapter summary
- UX design is an iterative loop; user-centred design involves users at every stage.
- A mind map explores a problem; research methods (interviews, surveys, competitive analysis) provide evidence, qualitative and quantitative.
- Personas and journey maps turn research into shared, human, visual artefacts; opportunities appear at the pain points.
- Ideation produces many options using mood boards, brainstorming and sketching before anything is built.
Practice
- Explain the five stages of the design-thinking process.
- What is user-centred design? List its steps.
- Draw a mind map for "online library system" (at least four branches).
- Write five good interview questions for a study of how students pay college fees and explain what makes each good. Rewrite one bad leading question.
- List four rules for writing survey questions. What is a double-barrelled question?
- Perform a competitive analysis table for two ride-hailing apps in Nepal on four criteria.
- Create a persona for a farmer using a mobile app for crop prices.
- Draw a journey map for "buying a bus ticket online" with five stages and the emotion curve.
- Differentiate between a mood board, a brainstorm and a sketch.
- Why are 5–12 participants sufficient for qualitative research but not for a survey?
Answers and worked solutions
1. Empathise (research users), define (state the problem), ideate (generate ideas), prototype (build quick versions), test (try with users and iterate).
2. A design approach that puts users' needs at the centre and involves them throughout; steps: specify context of use, specify requirements, produce design solutions, evaluate against requirements — repeating.
3. Central "Online library"; branches: users (students, teachers, librarian), tasks (search, borrow, renew, reserve), content (books, e-books, journals), rules (fines, limits), notifications, risks — each with sub-branches.
4. E.g. "Tell me about the last time you paid your fees" (open, past behaviour); "What was the hardest part?" (pain point); "Walk me through what you did first" (process); "How did you feel when…?" (emotion); "What would you change?" (improvement). Bad: "Don't you think online payment is easier?" → "How do you prefer to pay, and why?"
5. Short; one idea per question; neutral wording; pilot test; offer "not applicable". Double-barrelled = asks two things at once ("fast and easy"), so the answer is ambiguous.
6. A grid of criteria (price transparency, fare estimate, safety features, payment options) × two apps, with a conclusion listing gaps and conventions.
7. Name, age, location, phone type, goals (current prices, best market), frustrations (middlemen, low literacy, poor data), behaviour, context, quote.
8. Stages: search routes → select seat → pay → receive ticket → travel; actions/thoughts/emotions per stage; lowest emotion at payment failure or no confirmation.
9. Mood board — visual feel; brainstorming — group idea generation; sketch — rough drawing of a screen or flow.
10. Qualitative research looks for patterns of reasons, and most usability problems recur by the fifth user; surveys estimate proportions and need large samples for statistical confidence.
Model answers for Unit 2
Q1. Explain the UX design process (design thinking) and user-centred design. Show how the two are related. (10 marks)
Introduction. The UX design process is an iterative loop that turns an understanding of users into a tested product. The best-known model is the five-stage design-thinking model of the Stanford d.school (Fig. 2.1).
User-centred design (UCD) is the international standard way of working, described in ISO 9241-210, in which users are involved at every stage.
The five stages.
- Empathise. Learn about users through interviews, observation and surveys. The output is a set of findings, such as the affinity wall of Plate 2.1.
- Define. State the problem as a "how might we..." question with a user, a context and a measurable goal.
- Ideate. Produce many ideas using mind maps, brainstorming, mood boards and Crazy 8s (Fig. 2.6) before judging any.
- Prototype. Build quick, cheap models, from paper sketches to clickable screens (Plate 2.2).
- Test. Try the prototype with real users, learn, and go back to any earlier stage.
The double diamond. The Design Council's double diamond describes the same work as two diverge-then-converge phases: discover and define the problem, then develop and deliver the solution.
User-centred design (ISO 9241-210). UCD repeats four activities until the design meets its requirements: specify the context of use, specify the user requirements, produce design solutions, and evaluate them against the requirements.
Its principles are: base design on an explicit understanding of users, tasks and environments; involve users throughout; let user-centred evaluation drive the design; iterate; address the whole user experience; and use a multidisciplinary team.
| Point | Design thinking | UCD (ISO 9241-210) |
|---|---|---|
| Origin | Stanford d.school and IDEO practice | International standard |
| Shape | five stages | four activities |
| Research | Empathise | Context of use, user requirements |
| Creation | Ideate, prototype | Produce design solutions |
| Checking | Test | Evaluate against requirements |
| Common rule | iterate, involve users | iterate, involve users |
Relation. The two are the same idea in different words: empathise and define match context and requirements; ideate and prototype match producing solutions; test matches evaluation.
Example. A college asks, "How might we let remote students complete and pay for the exam form in under five minutes on a low-end phone?" The team interviews students, builds paper screens, tests with five users and repeats.
Conclusion. The process works because it replaces assumption with evidence at every loop; a design is finished when users, not designers, say it meets the goal.
Q2. What is a user interview? Describe good practice and explain how an affinity diagram turns interviews into insights. (5 marks)
A user interview is a one-to-one conversation of 20 to 60 minutes in which a researcher learns the participant's goals, context, pain points and vocabulary. It is a qualitative method: it answers why and how, not how many.
Good practice.
- Prepare a discussion guide of open questions, but stay flexible and follow interesting answers.
- Ask open questions about past behaviour. "Tell me about the last time you applied for an exam form" gives facts. "Don't you find the form confusing?" is a leading question and "Would you use an app?" produces polite lies.
- Dig for causes with the "five whys", and stay silent so the person fills the pause.
- Get consent, record only with permission, take notes and thank the participant.
- Recruit the right people: real students from the target group, not friends.
Affinity diagram. After about eight interviews, write every observation on its own sticky note, put the notes on a wall, move similar notes together and name each group (Plate 2.1a).
A group with many notes, such as "forms lose data", is a theme. Themes become insights, and insights become the problem statement.
Example. From eight student interviews, 24 notes fall into four groups: time-outs (9), language (6), payment doubts (6) and deadline confusion (3). Time-outs are fixed first.
Q3. Compare qualitative and quantitative UX research. Describe interviews, surveys and competitive analysis and say why 5 to 12 users are enough for one but not for the other. (10 marks)
Introduction. Research replaces guessing with evidence. Methods differ along two lines: qualitative versus quantitative, and attitudinal (what people say) versus behavioural (what people do). A good study combines them.
| Qualitative | Quantitative | |
|---|---|---|
| Question | why and how | how many, how much |
| Data | words, observations | numbers |
| Methods | interviews, field observation, diary studies, usability tests | surveys, analytics, A/B tests, click tracking |
| Sample | 5 to 12 people | hundreds or thousands |
| Output | themes, insights | percentages, trends |
User interviews. Open, non-leading questions about past behaviour; results are grouped with an affinity diagram.
Surveys. Questionnaires reach many people cheaply. Use multiple choice, Likert scales and few open boxes.
Keep them short, ask one idea per question (never the double-barrelled "Is the app fast and easy?"), use neutral wording, offer "not applicable" and pilot-test. A survey shows what and how many but not why.
Competitive analysis. List direct competitors (same product) and indirect competitors (different product, same need), choose criteria, fill a comparison matrix and record screenshots.
The result is opportunities (gaps, such as no offline mode or no Nepali language) and conventions (patterns users already expect).
Why the sample sizes differ. Fig. 2.3 shows that the share of problems found by n test users is 1 - (1 - 0.31)^n: five users find about 84 percent and ten about 98 percent, because later users repeat the same problems.
A survey estimates a percentage, so its accuracy depends on n: the 95 percent margin of error is 1.96 x \sqrt{0.25/n}, which is 9.8 points for 100 answers, 4.9 for 400 and 3.1 for 1000.
Worked example. A college wants to improve its exam-form portal. The team first runs a competitive analysis of two other portals and finds that neither works offline.
It then interviews eight students and learns that time-outs on mobile data are the main fear. Finally it sends a 10-question survey to 400 students: 62 percent say they lost a form at least once, with a margin of error of 4.9 points.
Interviews gave the reason, the survey gave the size, and the analysis gave the gap to fill.
Conclusion. Use interviews to find the reasons, surveys to measure how common they are, and competitive analysis to see the market. Small samples suit finding problems; large samples suit measuring them.
Q4. What is a user persona? Create a short persona for a student who pays college fees by phone and show how it affects design. (5 marks)
A persona is a fictional but research-based character that represents a group of real users. It keeps decisions tied to a specific person ("Would Sita use this?") instead of "the user", who is usually the designer in disguise.
Parts of a persona. Name and photo, demographics (age, job, place), goals, needs, frustrations, behaviours (devices and habits), context of use, and a short quote.
Example persona (Fig. 2.4). Sita Gurung, 20, BCA student, Pokhara. She uses a 4 GB Android phone on mobile data and shares a laptop with her brother.
Goal pay the fee and submit the form on time without travelling to college.
Frustrations the portal times out, forms lose data, forms are only in English and she gets no proof of payment.
Behaviour checks WhatsApp every hour and trusts eSewa.
Quote "I just want to know my form went through."
Design implications. Autosave the draft, resume from the last step, show Nepali labels and hints, pay by eSewa and send a receipt by SMS.
Rules. A persona must come from research data, not imagination; keep only three to five, with one primary persona; and update them. An assumption-based proto-persona is only a starting point to validate.
Q5. What is a user journey map? Explain its layout and the steps of building one using the exam-form journey. (10 marks)
Introduction. A user journey map is a diagram of the steps a persona takes to reach a goal over time and across touchpoints, together with what the persona does, thinks and feels.
It makes pain points visible to the whole team, so redesign starts where users suffer most.
Layout (Fig. 2.5). Columns are stages; rows are layers.
| Layer | Awareness | Application | Payment | Confirmation |
|---|---|---|---|---|
| Actions | hears of the deadline | opens portal, fills form | pays by eSewa | waits |
| Touchpoints | notice board, WhatsApp | website | eSewa app | SMS, email |
| Thoughts | "Is it really online?" | "Will my data be lost?" | "Is this safe?" | "Did it work?" |
| Emotion | curious (+1) | angry at timeout (-2) | anxious (-1) | unsure (-1) |
| Pain points | notice is unclear | session timeout | no receipt | no confirmation |
| Opportunities | SMS reminder | autosave draft | show receipt | instant SMS |
Steps to build one.
- Choose the persona and scenario (Sita applies for an exam form).
- List the stages of the journey, from first awareness to the end.
- Fill in actions, touchpoints, thoughts and emotions using research data.
- Draw the emotion curve: the lowest points, here the application stage, are where to redesign first.
- Mark moments of truth: high-stakes steps, here the payment, where trust is won or lost.
- Extract opportunities and turn them into features or backlog items.
Related tool. A service blueprint adds the back-stage processes (staff, systems) behind each step.
Value. The dashed curve in Fig. 2.5 shows the target journey after the opportunities are built, so the map is both a diagnosis and a goal.
Worked example. The lowest point of Sita's curve is the application stage (-2), because the portal times out and the typed data is lost. The team therefore builds autosave first.
The moment of truth is payment: if Sita does not see a receipt she will not trust the system, so the second feature is an eSewa receipt with an SMS.
After these two changes the expected curve rises to +1 at every stage, and a later round of testing checks whether it really does.
Conclusion. A journey map turns scattered research into one shared story. It is built from evidence, it ranks problems by emotion, and it ends in concrete opportunities.
Q6. Describe the three ideation techniques: mood boards, brainstorming and sketching. (5 marks)
After research and definition, ideate: produce many ideas before judging any.
- Mood board. A collage of images, colours, textures, typefaces and quotes that captures the look and feeling the design should have, for example "calm, trustworthy, youthful" (Plate 2.2a, b). It aligns the team and client before design starts. It is inspiration, not a design: it leads to a style guide with colours and fonts.
- Brainstorming. A group session to generate ideas quickly. The rules are defer judgement, aim for quantity, welcome wild ideas, build on others' ideas ("yes, and...") and keep to one conversation at a time. Variants are brainwriting (silent writing first), Crazy 8s (eight ideas in eight minutes, Fig. 2.6) and SCAMPER. Afterwards cluster the ideas and use dot voting.
- Sketching. Fast, rough pencil-and-paper drawings of screens and flows. Sketches are cheap, nobody fears throwing them away, and everyone can draw boxes and arrows. Types are thumbnails, storyboards and paper prototypes (Plate 2.2c). Wireframing starts here (Unit 6).
Example. For the exam-form app, a mood board gives calm blue and green, Crazy 8s gives eight flows, dot voting picks wizard plus autosave, and a paper prototype is tested with five students.