Unit 7 · 6 teaching hours · 34 min read
Design Evaluation
What the syllabus asks for 8
- Why and when to evaluate
- Usability testing
- Analysing test results
- Evaluation through expert analysis and user participation
- The DECIDE framework
- Heuristic evaluation
- Task analysis and performance metrics
- Seeing the ideas: tests, numbers, heuristics and task models
A design that nobody has tested is a guess. Evaluation is how you find out whether a design works for real people.
This unit covers formative and summative evaluation, usability testing (moderated and unmoderated), analysing results, expert and participatory evaluation, evaluation paradigms, the DECIDE framework, heuristic evaluation, and task analysis with performance metrics.
- Formative versus summative evaluation.
- Usability testing: planning, moderated vs unmoderated, running a session, how many users.
- Analysing test results: metrics, SUS scoring, severity ratings.
- Evaluation by experts and with users; evaluation paradigms.
- The DECIDE framework; Nielsen's ten heuristics; task analysis and performance metrics.
7.1 Why and when to evaluate
Evaluation checks that a design meets users' needs and the requirements, and finds problems while they are cheap to fix. It should be iterative: design → evaluate → redesign, repeating throughout the project.
Formative evaluation
Done during design, on sketches, wireframes and prototypes, to form (improve) the design. Qualitative, quick, small samples (3–8 users), many cycles. Questions: What is confusing? What should change? Examples: paper-prototype test, heuristic review of a wireframe, think-aloud sessions on a clickable prototype.
Summative evaluation
Done after (or at the end of) design, on a finished or near-final product, to sum up how well it performs against goals or competitors. Usually quantitative, larger samples, controlled conditions.
Questions: Does it meet the target (e.g. 90 % task success)? Is version B better than A? Examples: benchmark test, A/B test, SUS survey, comparison against a competitor.
| Formative | Summative | |
|---|---|---|
| When | during design | at the end / after release |
| Goal | improve | judge, compare, certify |
| Data | mostly qualitative | mostly quantitative |
| Sample | small (3–8) | larger (20–100+) |
| Output | list of problems and fixes | scores and statistics |
| Product state | prototype | working product |
7.2 Usability testing
Usability testing observes representative users attempting realistic tasks with the product, to see where they succeed and struggle. Its core rule: watch what they do, not what they say.
Planning a test
- Goals and questions: what do you want to learn? ("Can new students find and pay the exam fee?")
- Participants: recruit people who match the personas (5–8 for qualitative testing); screen them; get informed consent; compensate fairly.
- Tasks and scenarios: realistic, goal-based, not instructions: Good: "You need to pay your exam fee before Friday. Show me how you would do it." Bad: "Click the Payments tab."
- Environment and equipment: lab, the user's own place, or remote; device; screen and audio recording.
- Metrics: what will you measure (below)?
- Script: welcome, think-aloud instructions, tasks, follow-up questions, thanks.
- Pilot the test with a colleague.
Moderated versus unmoderated
| Moderated | Unmoderated | |
|---|---|---|
| Facilitator | a person guides the session, live or by video | none; the participant works alone with a tool (Maze, UserTesting, Lookback) |
| Probing | can ask "why?" and follow up | only written follow-up questions |
| Sample and speed | few participants, scheduled, slow | many participants, fast, cheap |
| Data | deep qualitative insight, facial and verbal cues | quantitative at scale (success, time, clicks), less context |
| Risks | moderator bias; leading questions | participants not serious; no recovery if they misunderstand a task |
| Best for | early prototypes, complex tasks, discovering why | validating a design, benchmarking, reaching many/diverse users |
Either can be in-person or remote. Think-aloud: the user speaks their thoughts while working ("I'm looking for payments… maybe under Profile?"). Retrospective think-aloud reviews a recording afterwards.
Running the session (moderator rules)
Be neutral; do not help or lead; if the user asks "Is this right?", reply "What would you expect?"; stay silent during pauses; note behaviour (hesitation, wrong clicks, errors, quotes), not opinions only; stop a task when the user gives up or time runs out; record success/failure; end with debrief questions and a SUS questionnaire.
How many users?
Nielsen and Landauer's model: the proportion of problems found by n users is 1 − (1 − L)ⁿ, where L ≈ 0.31 is the average chance that one user hits a given problem. n = 3 → 67 %; n = 5 → 84 %; n = 15 → 99.6 %.
So five users per round find most problems, and it is better to test five users, fix, then test five more, than to test fifteen once. (Quantitative studies need ≥ 20.) Test with each distinct user group.
7.3 Analysing test results
Measures and metrics
| Metric | Definition | Example |
|---|---|---|
| Task success (completion) rate | % of users who complete a task | 17 of 20 = 85 % |
| Time on task | seconds to complete (successful attempts) | mean of 42, 55, 38, 61, 47 = 48.6 s (median 47 s) |
| Error rate | errors per task or % of tasks with errors | 6 errors in 20 task attempts = 0.3 errors per task |
| Clicks / steps | steps needed vs the minimum | 9 clicks where 4 would do |
| Satisfaction | questionnaires (SUS, SEQ, NPS) | SUS = 85 |
| Learnability | improvement over repeated trials | time falls from 90 s to 40 s by trial 3 |
| Efficiency | success per unit time (or goals ÷ time) | 6 tasks in 30 min |
SUS — System Usability Scale
A 10-item questionnaire rated 1 (strongly disagree) to 5 (strongly agree), alternating positive (odd) and negative (even) statements: I think I would like to use this system frequently; I found the system unnecessarily complex; I thought it was easy to use; … Scoring: odd items contribute (response − 1), even items contribute (5 − response); add the ten contributions (0–40) and multiply by 2.5 for a score of 0–100.
Responses to items 1–10: 4, 2, 5, 1, 4, 2, 5, 1, 4, 2. Odd items (1, 3, 5, 7, 9): (4−1) + (5−1) + (4−1) + (5−1) + (4−1) = 3 + 4 + 3 + 4 + 3 = 17. Even items (2, 4, 6, 8, 10): (5−2) + (5−1) + (5−2) + (5−1) + (5−2) = 3 + 4 + 3 + 4 + 3 = 17. Sum = 34; SUS = 34 × 2.5 = 85.
Interpretation the average SUS is about 68; above 80 is excellent (grade A), below 51 is poor. (All neutral answers give 50; the best possible pattern gives 100. Do not read SUS as a percentage.)
Qualitative analysis and severity
Collect observations on notes, cluster by theme (affinity diagram), count how many users hit each problem, and write each as a finding (what happened, where, why, evidence/quote, recommendation). Rate each by severity:
| Rating | Meaning |
|---|---|
| 0 | not a usability problem |
| 1 | cosmetic — fix if time |
| 2 | minor — low priority |
| 3 | major — important to fix |
| 4 | catastrophic — must fix before release |
Priority = severity × frequency (and fix effort). The test report: goals, method, participants, tasks, results (metrics + findings), prioritised recommendations, highlights video clips. Report positive findings too.
A/B testing
A summative technique: show version A to one random group and B to another and compare a metric.
Example A converts 40 of 800 visitors (5.0 %), B converts 56 of 800 (7.0 %): an uplift of (7 − 5)/5 = 40 %; check statistical significance before acting. Needs enough traffic; tests what works, not why.
Related metrics: click-through rate (30 clicks / 600 visitors = 5 %), bounce rate, conversion.
7.4 Evaluation through expert analysis and user participation
| Expert (inspection) methods | User-participation methods | |
|---|---|---|
| Who | usability specialists or designers | real users |
| Methods | heuristic evaluation, cognitive walkthrough, guideline/standards review, consistency inspection, expert review of accessibility | usability tests, think-aloud, field studies, questionnaires, interviews, focus groups, diary studies, A/B tests, analytics |
| Speed and cost | fast, cheap, no recruitment | slower, costlier |
| Finds | violations of principles; obvious problems; consistency issues | real behaviours, the why, context problems, surprises |
| Weakness | experts are not users; false alarms | small samples; artificial setting |
Use both: experts clear obvious problems first, then users find what experts cannot predict.
Cognitive walkthrough: a specialist steps through a task asking at each step: Will the user try to achieve the right effect? Will they notice that the correct action is available? Will they associate the action with the effect? If the correct action is performed, will they see that progress is being made? — good for learnability by first-time users.
Evaluation paradigms (Preece et al.)
| Paradigm | Description |
|---|---|
| "Quick and dirty" | informal feedback from users or consultants at any stage; fast, cheap; the aim is to confirm ideas, not to produce rigorous data |
| Usability testing | measuring users' performance on typical tasks, often in a lab, with video, logs and questionnaires; mostly quantitative plus observation |
| Field studies | evaluation in the natural environment (home, workplace, village) to see real use and context; ethnography, interviews, observation |
| Predictive evaluation | experts predict usability problems without users: heuristics, walkthroughs; and models like GOMS/KLM and Fitts's law to predict performance |
Iterative evaluation means evaluating at each cycle with progressively higher-fidelity artefacts, so that findings drive the next version: sketch → wireframe test → prototype test → beta field test → post-release analytics.
7.5 The DECIDE framework
Preece, Rogers and Sharp's DECIDE is a checklist for planning an evaluation:
| Letter | Step | Questions |
|---|---|---|
| D | Determine the goals | What are the high-level goals? Who wants it and why? (e.g. "check whether new users can register in under 2 minutes") |
| E | Explore the questions | Break the goals into specific questions ("Can users find the sign-up button?") |
| C | Choose the evaluation approach and methods | Usability test, heuristic review, questionnaire, field study, A/B test — and budget and time |
| I | Identify the practical issues | Participants, facilities, equipment, schedule, budget, expertise, consent |
| D | Decide how to deal with the ethical issues | Informed consent, privacy and anonymity, right to withdraw, data protection, no harm |
| E | Evaluate, interpret and present the data | Reliability, validity, scope, biases, ecological validity; report the findings clearly |
Ethics: tell participants the purpose and what is recorded; stress that the product, not the person, is being tested; allow them to stop at any time; store data safely and anonymise.
7.6 Heuristic evaluation
Developed by Jakob Nielsen and Rolf Molich. Several evaluators (3–5 is ideal; one finds only ~35 % of problems) each inspect the interface independently against recognised heuristics, then combine their lists.
Steps choose heuristics; brief evaluators; each evaluator walks through the interface at least twice and records each problem with the heuristic violated and a severity; hold a debrief to merge and prioritise.
Nielsen's 10 usability heuristics
| # | Heuristic | Example of a violation |
|---|---|---|
| 1 | Visibility of system status — keep users informed with timely feedback | no progress indicator after pressing Pay |
| 2 | Match between system and the real world — users' language, familiar concepts | "Authentication failure code 17" |
| 3 | User control and freedom — undo, cancel, easy exit | no way to cancel a booking |
| 4 | Consistency and standards — same words and actions mean the same | "Submit" in one place and "Send" in another for the same action |
| 5 | Error prevention — design to avoid mistakes; confirm destructive actions | Delete next to Save with no confirmation |
| 6 | Recognition rather than recall — show options; don't make people remember | asking for a code shown on a previous page |
| 7 | Flexibility and efficiency of use — accelerators for experts, personalisation | no keyboard shortcuts or saved addresses |
| 8 | Aesthetic and minimalist design — no irrelevant information | a cluttered dashboard hiding the main action |
| 9 | Help users recognise, diagnose and recover from errors — plain language, precise cause, constructive fix | "Invalid input" without saying which field or why |
| 10 | Help and documentation — searchable, task-focused, concise | no help for a complex form |
Strengths: cheap, quick, no users needed. Weaknesses: evaluators' bias, may miss real-user problems, false positives; therefore combine with user testing.
7.7 Task analysis and performance metrics
Task analysis breaks a user's task into goals, sub-goals, actions and decisions to understand how it is done, and to find ways to simplify it.
Hierarchical Task Analysis (HTA) decomposes a goal into sub-tasks with a plan saying in what order and under what conditions they are done.
0. Pay exam fee (plan 0: do 1, then 2, then 3; repeat 2 if payment fails)
- Log in — 1.1 enter email, 1.2 enter password, 1.3 press Log in.
- Pay fee — 2.1 open Payments, 2.2 select exam, 2.3 choose eSewa, 2.4 confirm in eSewa.
- Save receipt — 3.1 view receipt, 3.2 download. Insights: 9 actions at the lowest level; steps 2.1–2.2 could be merged by showing the due fee on the home screen — a design improvement from the analysis.
GOMS (Goals, Operators, Methods, Selection rules) is a family of models that predict expert, error-free performance.
The simplest is the Keystroke-Level Model (KLM), which adds standard operator times: K keystroke ≈ 0.2 s, P point with mouse ≈ 1.1 s, B mouse button press/release ≈ 0.1 s (click = 2B), H move hand between keyboard and mouse ≈ 0.4 s, M mental preparation ≈ 1.35 s.
Search a site: M + P + click (2 B) + type 10 characters (10 K) + Enter (K) = 1.35 + 1.1 + 0.2 + 2.0 + 0.2 = 4.85 s.
Log in: M + P + click (2 B) + H + type 8-character username (8 K) + Tab (K) + 8-character password (8 K) + Enter (K) = 1.35 + 1.1 + 0.2 + 0.4 + 1.6 + 0.2 + 1.6 + 0.2 = 6.65 s.
A design that lets the browser autofill both fields would remove 16 K and the H operator, saving about 3.6 s per login. KLM lets you compare designs on paper, before any user test.
Performance metrics (summary)
Use measures tied to goals: effectiveness (task success, error rate), efficiency (time on task, number of steps, KLM-predicted time) and satisfaction (SUS, ratings).
Set targets in advance (e.g. "≥ 90 % complete registration unaided; median time ≤ 90 s; SUS ≥ 80") and compare the measured values with them.
Also analytics: drop-off in a funnel, conversion, bounce, search queries with no results, rage clicks.
7.8 Seeing the ideas: tests, numbers, heuristics and task models
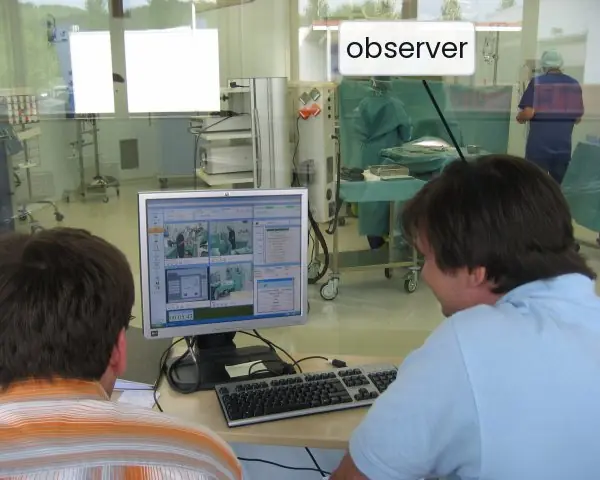
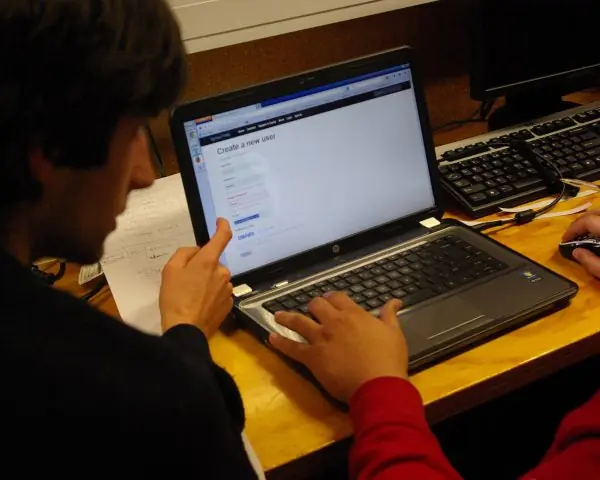
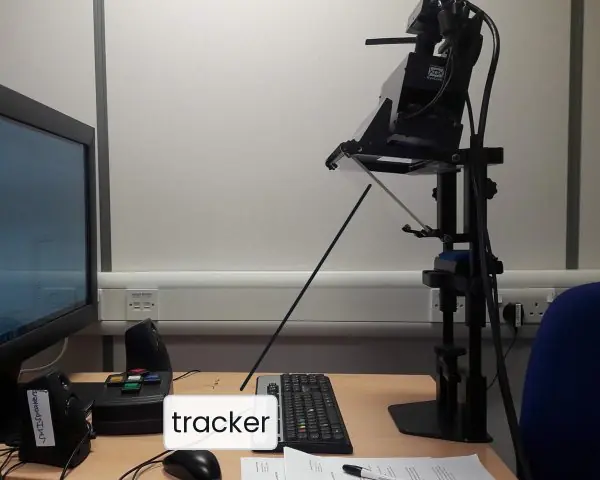
Evaluation is the part of design where opinions turn into evidence. Plate 7.1 shows real test set-ups: a participant at a workstation with an observer, a participant using a laptop during a user-experience test, and an eye tracker.
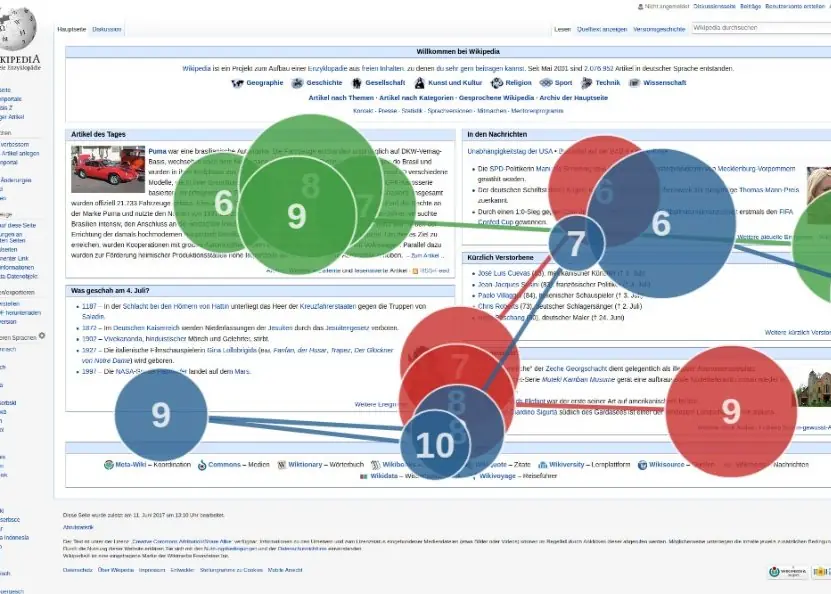
Plate 7.2 shows the output of an eye-tracking study and a priority matrix for deciding what to fix first.
The figures then compute how many users are enough, score a SUS questionnaire, compare three kinds of result with honest error bars, annotate a heuristic evaluation, decompose a task and time a login with the keystroke-level model.


7.8.1 Eight rules for evaluating a design well in Nepal
- Test early and often. Test a paper prototype (Plate 6.1b) before any code exists, then test again after every change. A team building a college result portal can find in one day that students look for "Result" and not "Examination". Early tests are cheap and every round makes the design better.
- Recruit the real users. Test with the people the product is for, not only with classmates. A Nagarik App style service needs an older citizen with a basic phone and a young person in a district town, and some test users should read Nepali better than English. If you test only with your friends, you will miss the problems that matter most.
- Give tasks, not instructions. Say "Pay your exam fee before Friday" and not "Click the Payments tab". The user then shows how they would really find the way. Realistic tasks reveal wrong labels, hidden buttons and missing steps.
- Watch what people do. Ask the user to think aloud and stay silent while they work. Note hesitation, wrong taps and quotes, because behaviour tells the truth where opinions can be polite. If a user says "it was fine" after three failed attempts, believe the attempts.
- Use five users per round. One round of five users finds about 84 percent of the problems (Fig. 7.1), so test five, fix, and test five more. Do not wait for fifty users before changing the design. Use larger samples only when you need numbers, such as a benchmark.
- Combine experts and users. A heuristic review (Fig. 7.4) is quick and clears obvious faults such as "Invalid input" messages and a Delete button beside Save. Real users then find the problems that experts cannot predict, such as a weak mobile signal in a village. Do the cheap review first and the user test second.
- Measure and report honestly. Record success rate, time on task, errors and a SUS score (Fig. 7.2), and give the interval when the sample is small (Fig. 7.3). Rate every problem by severity and by how many users hit it (Plate 7.2b). A short, prioritised report is more useful than a long list that nobody reads.
- Respect the participants. Explain the purpose, say that the product and not the person is being tested, ask for consent and allow them to stop at any time. Do not record faces or share data without permission, and keep their records safe. Careful ethics protects people and also makes them speak more freely, which gives better data.
Formula and fact sheet
- Formative = during, improve, qualitative; summative = after, judge, quantitative.
- Moderated = depth and why; unmoderated = scale and speed. Think-aloud.
- Problems found by n users = 1 − (1 − 0.31)ⁿ: n = 3 → 67 %, n = 5 → 84 %, n = 15 → 99.6 %.
- Success rate = completed/attempted; error rate = errors/tasks; mean time on task.
- SUS = (Σ(odd − 1) + Σ(5 − even)) × 2.5; average ≈ 68; neutral = 50.
- Severity 0–4; priority = severity × frequency. A/B uplift = (B − A)/A.
- DECIDE: Determine, Explore, Choose, Identify, Decide, Evaluate.
- KLM: K 0.2, P 1.1, B 0.1, H 0.4, M 1.35 seconds.
Chapter summary
- Evaluate iteratively: formative evaluation improves a design while it is made, summative evaluation judges the result.
- Usability tests observe representative users on realistic tasks; moderated tests give depth, unmoderated tests give scale; five users per round find most problems.
- Analyse with success rate, time, errors, SUS and severity-rated findings, then recommend fixes by priority.
- Expert methods (heuristic evaluation, walkthroughs) and user methods complement each other; paradigms range from quick-and-dirty to field studies and predictive models.
- DECIDE structures an evaluation plan; Nielsen's ten heuristics structure an expert review.
- Task analysis (HTA) and KLM predict and compare task effort.
Practice
- Differentiate formative and summative evaluation with examples.
- Compare moderated and unmoderated usability testing.
- Plan a usability test for a college fee-payment app: goals, participants, three tasks, metrics.
- How many users find 75 % of the problems if L = 0.31? (Find the smallest n.)
- Compute SUS for responses 5, 1, 4, 2, 5, 1, 4, 2, 5, 1 and interpret.
- Twelve users attempt a task; 9 succeed. Times (s) for the successful ones: 30, 35, 28, 40, 33, 31, 45, 38, 36. Find the success rate and mean time.
- Explain DECIDE with one line per letter.
- List Nielsen's ten heuristics and identify which one is violated by(a) "Error 404x7" and(b) no undo after deleting a message.
- Draw an HTA for "withdraw cash from an ATM".
- Use KLM to compare logging in by typing 8 + 8 characters with using a fingerprint (M + P-free single touch, assume M + 1 key press of 0.2 s).
Answers and worked solutions
1. Formative: during design, qualitative, e.g. testing a paper prototype with 5 users; summative: after release, quantitative, e.g. an A/B test or benchmark with 50 users against targets.
2. Moderated: a facilitator probes, small sample, deeper insight; unmoderated: tool-led, many participants, faster and cheaper, less context (see the table in 7.2).
3. Goal: can students pay their fee within 2 minutes? Participants: 5–8 students of mixed devices and ability. Tasks: log in; find the fee due; pay and obtain a receipt. Metrics: success rate, time on task, errors, SUS.
4. 1 − 0.69ⁿ ≥ 0.75 ⇒ 0.69ⁿ ≤ 0.25 ⇒ n ≥ ln 0.25/ln 0.69 = 3.73 ⇒ n = 4 (1 − 0.69⁴ = 77 %).
5. Odd items: 5, 4, 5, 4, 5 → (4 + 3 + 4 + 3 + 4) = 18; even items: 1, 2, 1, 2, 1 → (4 + 3 + 4 + 3 + 4) = 18; sum 36 × 2.5 = 90 — excellent, well above the 68 average.
6. Success rate = 9/12 = 75 %. Mean time = (30 + 35 + 28 + 40 + 33 + 31 + 45 + 38 + 36)/9 = 316/9 = 35.1 s.
7. Determine goals; Explore questions; Choose methods; Identify practical issues; Decide ethical issues; Evaluate, interpret and present data.
8. The ten heuristics are listed in 7.6.(a) violates #9 (error messages in plain language) and #2 (real-world language);(b) violates #3 (user control and freedom).
9. 0. Withdraw cash (plan: 1 → 2 → 3 → 4 → 5): 1 insert card; 2 enter PIN; 3 choose Withdraw and the amount; 4 take card; 5 take cash and receipt.
10. Typing: 6.65 s (see 7.7). Fingerprint: M + one touch (0.2 s) = 1.35 + 0.2 = 1.55 s, about 4.3 times faster.
Model answers for Unit 7
Q1. Explain formative and summative evaluation, and describe how a usability test is planned, run and analysed. (10 marks)
Introduction. Evaluation checks whether a design meets users' needs and the requirements, and finds problems while they are cheap to fix. It is iterative: design, evaluate, redesign. Two kinds are used at different times.
Formative and summative evaluation.
| Point | Formative | Summative |
|---|---|---|
| When | during design | at the end or after release |
| Aim | improve the design | judge it against goals or rivals |
| Data | mostly qualitative | mostly quantitative |
| Sample | small, 3 to 8 users | larger, 20 to 100 or more |
| Output | a list of problems and fixes | scores and statistics |
| Example | paper-prototype test (Plate 6.1b) | benchmark, A/B test, SUS survey |
Planning a usability test. A usability test observes representative users attempting realistic tasks, and its core rule is to watch what they do and not only what they say (Plate 7.1).
- Goals: what do you want to learn, for example "Can new students find and pay the exam fee?"
- Participants: five to eight people who match the personas, with informed consent and fair compensation.
- Tasks: realistic scenarios, not instructions: "Pay your exam fee before Friday."
- Environment and equipment: lab or the user's own place, the device, screen and audio recording.
- Metrics: success rate, time on task, errors, satisfaction.
- Script and pilot: welcome, think-aloud instruction, tasks, debrief, and a trial run with a colleague.
Running the session. The moderator stays neutral, does not help or lead, answers "Is this right?" with "What would you expect?", tolerates silence and notes behaviour such as hesitation, wrong taps and quotes.
A SUS questionnaire ends the session. Tests may be moderated (depth, the why) or unmoderated (scale and speed).
Analysing results. Compute the task success rate (17 of 20 = 85 percent, interval 64 to 95 percent, Fig. 7.3), the mean and median time, the error rate and the SUS score (Fig. 7.2).
Cluster the observations by theme, count how many users hit each problem and rate its severity from 0 to 4. Priority is severity multiplied by frequency (Plate 7.2b).
The report lists goals, method, participants, results and ranked recommendations.
Conclusion. Formative tests shape the design with small, frequent rounds, and summative tests prove it against targets. A well-planned test with realistic tasks and honest numbers turns opinions into evidence.
Q2. Compare moderated and unmoderated usability testing. (5 marks)
In moderated testing a facilitator guides each participant, live or by video, and can ask "why?". In unmoderated testing the participant works alone with a tool such as Maze or UserTesting and the system collects the data.
| Point | Moderated | Unmoderated |
|---|---|---|
| Facilitator | present and probing | none, written questions only |
| Sample and speed | few people, scheduled, slow | many people, fast, cheap |
| Data | deep insight, speech and facial cues | scale: success, time, clicks, less context |
| Risks | moderator bias, leading questions | participants may rush; a misunderstood task cannot be rescued |
| Best for | early prototypes, complex tasks, finding the why | validating a design, benchmarks, reaching many users |
Both can be in person or remote. A think-aloud protocol asks users to speak their thoughts as they work, and a retrospective think-aloud reviews the recording afterwards.
Recommendation. Start with moderated sessions on a prototype to discover problems, then use unmoderated tests to confirm that the fixed design works for a wide group, for example students in many districts using a fee-payment app on different phones.
Q3. How many users are needed for a usability test? Show the calculation. (5 marks)
Nielsen and Landauer's model. The share of usability problems found by n users is 1 - (1 - L)^n, where L is the average chance that one user meets a given problem, about 0.31.
| Users n | Share found |
|---|---|
| 1 | 31 percent |
| 3 | 1 - 0.69^{3} = 67 percent |
| 4 | 77 percent |
| 5 | 1 - 0.69^{5} = 84 percent |
| 15 | 99.6 percent |
Worked example. The least n for 75 percent: 0.69^{n} ≤ 0.25, so n ≥ ln 0.25 / ln 0.69 = 3.73, so n = 4 (Fig. 7.1).
Meaning. The curve flattens quickly, so the sixth user adds little. It is better to test five users, fix the problems, and test five more than to test fifteen once, because each round finds what the last round exposed.
Cautions. The model assumes users are similar, so test each distinct group (for example students and teachers) separately.
Quantitative studies, such as benchmarks and A/B tests, need 20 or more users, and a small sample gives wide intervals (Fig. 7.3). Heuristic evaluation has a lower L of about 0.35 per evaluator, so three to five evaluators are used.
Q4. Compute the SUS score for the answers 5, 1, 4, 2, 5, 1, 4, 2, 5, 1 and interpret it. (5 marks)
The System Usability Scale (SUS) is a ten-item questionnaire, each item rated 1 (strongly disagree) to 5 (strongly agree).
Odd items are positive statements ("I thought the system was easy to use") and even items are negative ("I found the system unnecessarily complex").
Scoring rule. Odd items contribute answer minus 1, even items contribute 5 minus answer. Add the ten contributions (0 to 40) and multiply by 2.5 to get a score from 0 to 100.
Calculation.
| Item | 1 | 2 | 3 | 4 | 5 | 6 | 7 | 8 | 9 | 10 |
|---|---|---|---|---|---|---|---|---|---|---|
| Answer | 5 | 1 | 4 | 2 | 5 | 1 | 4 | 2 | 5 | 1 |
| Contribution | 4 | 4 | 3 | 3 | 4 | 4 | 3 | 3 | 4 | 4 |
The sum is 4 + 4 + 3 + 3 + 4 + 4 + 3 + 3 + 4 + 4 = 36, and SUS = 36 x 2.5 = 90.
Interpretation (Fig. 7.2). The average SUS is about 68; below 51 is poor; above 80 is excellent. A score of 90 is therefore excellent. Cautions. SUS is not a percentage, so 90 does not mean "90 percent usable".
It says how satisfied users feel but not what is wrong, so it must be combined with task metrics and observation. All neutral answers (3) give exactly 50.
Q5. Explain heuristic evaluation and list Nielsen's ten usability heuristics with an example of a violation of each. (10 marks)
Introduction. Heuristic evaluation, developed by Jakob Nielsen and Rolf Molich, is an inspection method in which a small group of evaluators examines an interface independently against recognised usability principles, called heuristics.
It needs no users and is fast and cheap.
Procedure.
- Choose the heuristics, usually Nielsen's ten.
- Brief three to five evaluators; one evaluator finds only about 35 percent of the problems, five find about 88 percent (Fig. 7.1).
- Each evaluator goes through the interface at least twice alone and records every problem with the heuristic broken and a severity from 0 to 4.
- At a debrief the lists are merged, duplicates removed and the problems ranked (Fig. 7.4).
Nielsen's ten heuristics.
| # | Heuristic | Example of a violation |
|---|---|---|
| 1 | Visibility of system status | no progress indicator after pressing Pay |
| 2 | Match between system and the real world | "Authentication failure code 17" |
| 3 | User control and freedom | no way to cancel a booking |
| 4 | Consistency and standards | Submit on one screen, Send on another for the same action |
| 5 | Error prevention | Delete beside Save with no confirmation |
| 6 | Recognition rather than recall | asking for a code shown on a previous page |
| 7 | Flexibility and efficiency of use | no saved addresses or shortcuts |
| 8 | Aesthetic and minimalist design | a cluttered dashboard hiding the main action |
| 9 | Help users recognise, diagnose and recover from errors | "Invalid input" without saying which field |
| 10 | Help and documentation | no help for a long government form |
Strengths and weaknesses. Strengths: quick, cheap, usable on wireframes and no recruiting. Weaknesses: evaluators are not real users, may be biased and may report false alarms, so the method should be followed by a user test.
Worked example (Fig. 7.4). Three evaluators review a fee-payment screen.
Evaluator A reports that Pay gives no progress sign (H1, severity 3); B reports that Delete sits beside Save with no confirmation (H5, severity 4); C reports that the message "Invalid input" does not name the field (H9, severity 3).
At the debrief the team merges the lists, fixes the severity 4 problem first and then the two severity 3 problems, and re-tests the screen with five real users.
Conclusion. A heuristic review clears obvious problems cheaply, and a usability test then finds the problems that experts cannot predict.
Q6. Explain the DECIDE framework for planning an evaluation. (5 marks)
DECIDE, by Preece, Rogers and Sharp, is a six-step checklist that keeps an evaluation focused and ethical.
| Letter | Step | Question to answer |
|---|---|---|
| D | Determine the goals | Why evaluate, and who wants the answer? Example: can new users register in under 2 minutes? |
| E | Explore the questions | Turn each goal into specific questions: can users find the Sign up button? |
| C | Choose the approach and methods | usability test, heuristic review, questionnaire, field study or A/B test, within budget and time |
| I | Identify the practical issues | participants, facilities, equipment, schedule, expertise |
| D | Decide how to deal with ethical issues | informed consent, privacy, right to withdraw, data protection |
| E | Evaluate, interpret and present the data | reliability, validity, biases, and a clear report |
Ethics. Tell participants the purpose and what is recorded, stress that the product and not the person is tested, let them stop at any time and store data safely and anonymously.
Example. For a college app: determine the goal (registration under 2 minutes); explore whether the button is findable; choose a moderated test with five students; identify a lab room and two phones; decide on consent forms; evaluate success rate, time and SUS and present ranked findings.
Q7. What is task analysis? Draw the HTA for paying an exam fee, and compute the keystroke-level time for logging in. (5 marks)
Task analysis breaks a task into goals, sub-goals, actions and decisions so that it can be understood and simplified. Hierarchical Task Analysis (HTA) splits a goal into sub-tasks and adds a plan that says in what order and under what conditions they run (Fig. 7.5).
HTA of "Pay exam fee". Plan 0: do 1, then 2, then 3; repeat 2 if payment fails.
Step 1 log in (enter email, enter password, press Log in); step 2 pay fee (open Payments, select exam, choose eSewa, confirm in eSewa); step 3 save receipt (view, download). There are 9 actions.
A design improvement is to show the fee due on the home screen, which merges steps 2.1 and 2.2 and leaves 8 actions.
Keystroke-level model. KLM adds standard operator times: K 0.2 s, P 1.1 s, B 0.1 s (a click is 2B), H 0.4 s, M 1.35 s. Logging in by typing: M + P + click + H + 8 K + Tab + 8 K + Enter = 1.35 + 1.1 + 0.2 + 0.4 + 1.6 + 0.2 + 1.6 + 0.2 = 6.65 s.
With a fingerprint: M + one touch = 1.35 + 0.2 = 1.55 s, about 4.3 times faster (Fig. 7.6). KLM predicts the speed of an expert doing the task without errors, so it compares designs on paper before any user test.