Unit 4 · 16 teaching hours · 67 min read
Programming in Python
What the syllabus asks for 7
- Revision of the basics of Python: data types, variables, operators, input/output, selection and loops
- User-defined functions: defining and calling functions, passing parameters and returning values
- Concept of library and packages in Python: modules, math, random, datetime and pip
- Graphics using Turtle
- Error handling: syntax errors, runtime errors and exceptions, try-except blocks
- File handling: text files, and CSV files with the pandas library
- Introduction to data visualization with Matplotlib: line, bar and pie charts
In Class 9 you met Python: variables, input and output, decisions and loops. This unit builds on that until you can write programs that do real work — programs split into reusable functions, programs that use ready-made libraries for maths, random numbers and dates, programs that draw with Turtle, survive mistakes with try-except, keep data in files, read spreadsheets with pandas, and turn numbers into charts with Matplotlib. Every program in this chapter was run in Python 3.12, and the output printed under it is exactly what Python produced. Type them in, run them, then change them: that is how programming is learnt.
This is the heaviest unit of the paper: 12 marks in the CDC grid —
two MCQs (2 marks), three short questions (3 × 2 = 6 marks) and one
long question (4 marks). MCQs test a keyword, an operator, a library or the
output of a line of code. Short questions ask you to write a small function
(e.g. one that returns an area), a try-except block, or to say how a chart
helps. The long question gives a short program — often pandas — and asks for
its output and a modification. In program answers the marker gives a
mark for each key element: correct def header, correct use of the parameter,
the return, the call, correct indentation and the right output, so write
complete, properly indented code.
4.1 Revision of the basics of Python
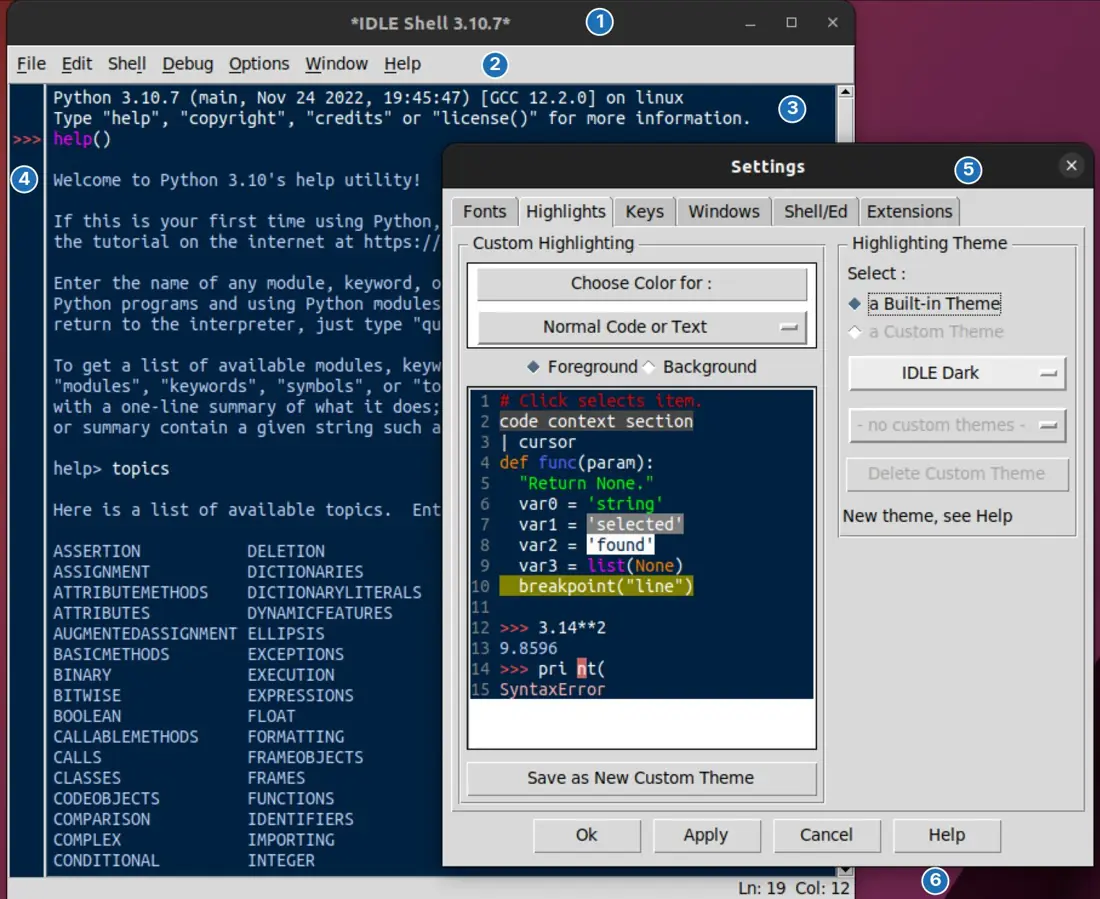
Python programs are written and run in an editor such as IDLE (installed
with Python from python.org), Thonny or VS Code, or in an online interpreter.
In the interactive mode (the Python shell, with its >>> prompt) each
statement runs as soon as you press Enter; in the script mode you write a
whole program in a file ending in .py and run it (in IDLE: Run → Run
Module, or F5).
Input and output
print() displays values, separated by spaces; input() shows a prompt, waits
for the user to type and press Enter, and always returns a string — so
convert it with int() or float() before doing arithmetic. An f-string
(f"...") puts the value of a variable inside text wherever {variable}
appears.
Problem. Ask the user's name and age, greet them, and say how old they will be next year.
Solution.
name = input("Enter your name: ")
age = int(input("Enter your age: "))
print("Namaste,", name)
print("Next year you will be", age + 1)
print(f"{name} is {age} years old.")
Enter your name: Sujata
Enter your age: 15
Namaste, Sujata
Next year you will be 16
Sujata is 15 years old.
Without int(), age + 1 would fail, because age would be the text "15".
Data types, identifiers and variables
| Type | Holds | Examples |
|---|---|---|
int |
whole numbers of any size (limited only by memory) | -7, 0, 2083 |
float |
numbers with a decimal point | 3.14, -0.5, 2.0 |
str |
text in single, double or triple quotes | 'Ram', "Bhaktapur1", """many lines""" |
bool |
True or False |
is_student = True |
list |
an ordered, changeable collection in [ ] |
["Computer", "Science", 20, True] |
An identifier is the name given to a variable, function or other object.
It may contain letters, digits and _, must not start with a digit, must not be
a keyword (if, for, def, True …) and is case-sensitive (Marks and
marks are different). A variable is created the moment a value is
assigned to it: a = 15. The built-in type() tells you the type of a value.
Operators
| Group | Operators | Example | Result |
|---|---|---|---|
| Arithmetic | + - * / |
17 / 5 |
3.4 (always a float) |
// floor division |
17 // 5 |
3 |
|
% modulus (remainder) |
17 % 5 |
2 |
|
** exponent |
2 ** 10 |
1024 |
|
| Relational | == != > < >= <= |
5 == 5, 3 != 5 |
True, True |
| Logical | and or not |
(7 > 5) and (3 > 9) |
False |
| Assignment | = += -= *= /= //= %= |
count += 1 |
adds 1 to count |
and is True only when both sides are True; or is True when at least one
side is True; not reverses True and False.
Problem. Predict, then check, the output.
Solution.
a = 17
b = 5
print(a + b, a - b, a * b)
print(a / b, a // b, a % b)
print(2 ** 10, 20 / 10)
print(-17 // 5, -17 % 5)
print(type(a), type(a / b), type("17"), type(a > b))
22 12 85
3.4 3 2
1024 2.0
-4 3
<class 'int'> <class 'float'> <class 'str'> <class 'bool'>
/ always gives a float: 20 / 10 is 2.0, not 2 as some books print.
And // rounds down (towards minus infinity), not towards zero:
-17 // 5 is -4, because −3.4 rounded down is −4.
Selection: if, if-else, if-elif-else and nested if
An if statement runs its indented block only when its condition is True.
if-else chooses between two blocks; if-elif-else checks conditions in order
and runs the first block whose condition is True; a nested if is an
if inside another if. The colon : and the indentation (4 spaces) are part
of the syntax.
Problem. Read a percentage and print the SEE letter grade.
Solution.
marks = float(input("Enter percentage: "))
if marks >= 90:
    grade = "A+"
elif marks >= 80:
    grade = "A"
elif marks >= 70:
    grade = "B+"
elif marks >= 60:
    grade = "B"
elif marks >= 50:
    grade = "C+"
elif marks >= 40:
    grade = "C"
elif marks >= 35:
    grade = "D"
else:
    grade = "NG"
print("Grade:", grade)
Enter percentage: 86.5
Grade: A
With 33 the output is Grade: NG. Because the conditions are checked from the
top, elif marks >= 80 is reached only when the mark is below 90.
Problem. Read an integer; print Positive, Negative or Zero, and for a positive number also print Even or Odd.
Solution.
n = int(input("Enter an integer: "))
if n > 0:
    print("Positive")
    if n % 2 == 0:
        print("Even")
    else:
        print("Odd")
elif n < 0:
    print("Negative")
else:
    print("Zero")
Three runs:
Enter an integer: 7
Positive
Odd
Enter an integer: -4
Negative
Enter an integer: 0
Zero
Iteration: for and while loops
Iteration means repeating a block of statements. A for loop repeats
once for each item of a sequence and is used when the number of repetitions is
known; range(start, stop, step) produces the numbers from start up to but
not including stop. A while loop repeats as long as its condition is
True and is used when the number of repetitions is not known in advance.
| Call | Numbers produced |
|---|---|
range(5) |
0, 1, 2, 3, 4 |
range(1, 11) |
1 to 10 |
range(2, 21, 2) |
2, 4, 6, …, 20 |
range(10, 0, -1) |
10 down to 1 |
Problem. Print the multiplication table of a number up to 10.
Solution.
n = int(input("Enter a number: "))
for i in range(1, 11):
    print(n, "x", i, "=", n * i)
Enter a number: 7
7 x 1 = 7
7 x 2 = 14
7 x 3 = 21
7 x 4 = 28
7 x 5 = 35
7 x 6 = 42
7 x 7 = 49
7 x 8 = 56
7 x 9 = 63
7 x 10 = 70
Problem. Find the sum of the digits of a number and the number reversed.
Solution. num % 10 gives the last digit and num // 10 removes it.
num = int(input("Enter a number: "))
total = 0
rev = 0
while num > 0:
    digit = num % 10
    total = total + digit
    rev = rev * 10 + digit
    num = num // 10
print("Sum of digits:", total)
print("Reversed number:", rev)
Enter a number: 4521
Sum of digits: 12
Reversed number: 1254
Lists
A list stores many values in one variable, in order. Items are numbered
from 0: marks[0] is the first item and marks[-1] the last. append()
adds an item; len(), sum(), max() and min() work on the whole list; a
for loop visits every item.
Problem. Store five marks in a list, add a sixth, and print the count, total, highest, lowest, average and every distinction (80 or more).
Solution.
marks = [78, 92, 65, 88, 54]
print("Marks:", marks)
print("First:", marks[0], "Last:", marks[-1])
marks.append(81)
print("Number of marks:", len(marks))
print("Total:", sum(marks), "Highest:", max(marks), "Lowest:", min(marks))
print("Average:", round(sum(marks) / len(marks), 2))
for m in marks:
    if m >= 80:
        print(m, "is a distinction")
Marks: [78, 92, 65, 88, 54]
First: 78 Last: 54
Number of marks: 6
Total: 458 Highest: 92 Lowest: 54
Average: 76.33
92 is a distinction
88 is a distinction
81 is a distinction
Type and run Programs 4.1 to 4.7. Then fix the textbook's "Let's solve"
program, whose = signs were lost in printing: it should read
days = int(input("Enter days: ")), months = days / 30,
days = days % 30. With 75 days it prints Months = 2 Days = 15.
4.2 User-defined functions
A function is a named block of organised, reusable code that performs one task. It runs only when it is called, may receive values through parameters, and may send a result back with return.
Python has built-in functions that are always available — print(),
input(), int(), len(), sum(), max(), round(), type() — and lets
you write your own user-defined functions with the keyword def. Functions
make a program modular (split into small parts), reusable (write once,
call many times), easier to read, test and correct.
def function_name(parameter1, parameter2):
    statements
    return value          # optional
The header starts with def, ends with a colon, and the body is indented. A
function may have no parameters and need not return anything. Its name follows
the rules for identifiers.
Problem. Write a function that returns the sum of two numbers and call it.
Solution.
def add_numbers(x, y):
    total = x + y
    return total

num1 = 5
num2 = 6
print("The sum is", add_numbers(num1, num2))
The sum is 11
Python reads the def but runs nothing until the last line calls
add_numbers(5, 6); the call is then replaced by the returned value, 11.
Parameters and arguments
Parameters are the names written in the function header, x and y
above. Arguments are the actual values passed in the call, num1 and
num2 (5 and 6). An argument can be a constant, a variable or an expression.
| Kind of argument | How it is passed | Example call for def interest(prin, time, rate) |
|---|---|---|
| Positional (required) | in the same order as the parameters | interest(20000, 2, 10) |
| Default | the parameter has a value in the header, so the argument may be left out | def interest(prin, time, rate=10) → interest(20000, 2) |
| Keyword (named) | written as name=value, in any order |
interest(rate=8, prin=20000, time=3) |
Problem. Write a simple-interest function whose rate is 10 % unless another rate is given, and call it three ways.
Solution.
def simple_interest(principal, time, rate=10):
    return principal * time * rate / 100

print(simple_interest(50000, 2))
print(simple_interest(50000, 2, 12))
print(simple_interest(rate=8, principal=20000, time=3))
10000.0
12000.0
4800.0
def interest(prin, time=2, rate): is illegal, because a parameter without a
default may not follow one with a default. Python 3.12 refuses to run it:
    def interest(prin, time=2, rate):
                               ^^^^
SyntaxError: parameter without a default follows parameter with a default
Returning values
A function that sends back a value with return is a non-void (fruitful)
function; its call can be printed, stored or used in an expression. A function
that only does something, such as printing, is a void function; it returns
the special value None. A function can also return several values
separated by commas: Python packs them into a tuple, which can be unpacked
into separate variables.
Problem. Write a function area_circle(r) that returns the area of a
circle using 3.14 for π, and call it.
Solution.
def area_circle(r):
    return 3.14 * r * r

r = float(input("Enter radius: "))
print("Area =", area_circle(r))
Enter radius: 7
Area = 153.86
Problem. Return the square and cube of a number; then show what a void function returns.
Solution.
def square_and_cube(n):
    return n ** 2, n ** 3

result = square_and_cube(4)
print(result, type(result))
sq, cb = square_and_cube(5)
print("Square:", sq, "Cube:", cb)

def greet(name):
    print("Namaste,", name)

value = greet("Sita")
print("greet() returned:", value)
(16, 64) <class 'tuple'>
Square: 25 Cube: 125
Namaste, Sita
greet() returned: None
Scope of variables
The scope of a variable is the part of the program where it can be used. A variable created inside a function is local: it exists only while the function runs and cannot be used outside it. A variable created outside all functions is global: it can be read anywhere in the program, including inside functions.
Problem. Predict the output.
Solution.
school = "Shree Janata Secondary School"    # global variable

def show():
    message = "Welcome to"                     # local variable
    print(message, school)

show()
print(school)
print(message)
Welcome to Shree Janata Secondary School
Shree Janata Secondary School
Traceback (most recent call last):
  File "scope.py", line 9, in <module>
    print(message)
          ^^^^^^^
NameError: name 'message' is not defined
The function can read the global school, but message disappeared when
show() finished, so the last line fails. (Tracebacks in this chapter show
only the file name; on your computer the full folder path appears.)
Problem. (a) Write is_prime(n) and test it on a few numbers. (b) Write a
function that generates the series 2, 3, 5, 8, 13, … (each term the sum of the
two before it) up to 10 terms and print the series and its sum.
Solution.
def is_prime(n):
    if n < 2:
        return False
    for i in range(2, int(n ** 0.5) + 1):
        if n % i == 0:
            return False
    return True

for number in [1, 2, 9, 17, 91, 97]:
    print(number, "is prime" if is_prime(number) else "is not prime")

def generate_series(n):
    series = [2, 3]
    for i in range(2, n):
        series.append(series[i - 1] + series[i - 2])
    return series

terms = generate_series(10)
print("Series:", *terms)
print("Sum of the series:", sum(terms))
1 is not prime
2 is prime
9 is not prime
17 is prime
91 is not prime
97 is prime
Series: 2 3 5 8 13 21 34 55 89 144
Sum of the series: 374
A divisor larger than √n would need a partner smaller than √n, so checking up
to √n is enough. *terms prints the list's items separated by spaces.
4.3 Libraries, packages and modules: math, random, datetime and pip
A module is a single Python file (.py) containing functions, variables
and classes that other programs can use — math and random are modules. A
package is a folder of related modules (it contains a file called
__init__.py), used through the dot operator, as in matplotlib.pyplot. A
library is a large collection of modules and packages that together serve
one kind of need — NumPy for scientific computing, pandas for data,
Matplotlib for charts.
Python comes with a standard library of modules that need no
installation: math, random, datetime, csv, turtle, os and many
more. Third-party libraries such as pandas, matplotlib, numpy,
seaborn, plotly and requests are installed separately with pip.
Libraries save time: instead of writing a square-root routine or a chart from
scratch, you import code that thousands of programmers have already tested.
The textbook calls math a "package"; it is a module (one file of
functions). And it gives import requests as an example of a standard
library; requests is a third-party package that must first be installed
with pip install requests.
| Way of importing | Example | How you then call the function |
|---|---|---|
| the whole module | import math |
math.sqrt(25) |
| one or more names | from math import sqrt, pi |
sqrt(25) |
| with a short alias | import datetime as dt |
dt.date(2082, 1, 1) |
| every name (avoid) | from math import * |
sin(90) |
from module import * makes every name available without the module prefix,
but it can silently replace your own variables with the module's, so programs
are clearer with import module or a named import.
Problem. Show each import style at work.
Solution.
from math import sqrt, pi
print(sqrt(25))
print(round(pi, 4))

import datetime as dt
print(dt.date(2082, 1, 1).year)

from math import *
print(sin(90))
5.0
3.1416
2082
0.8939966636005579
sin(90) is not 1: the trigonometric functions of math work in
radians, and 90 radians is a different angle from 90°. Use
sin(radians(90)) for degrees.
The math module
| Function or constant | Meaning | Example and result |
|---|---|---|
math.sqrt(x) |
square root | math.sqrt(256) → 16.0 |
math.pow(x, y) |
x to the power y (as a float) | math.pow(2, 10) → 1024.0 |
math.pi, math.e |
the constants π and e | 3.141592653589793 |
math.ceil(x), math.floor(x) |
round up, round down | ceil(4.2) → 5, floor(4.8) → 4 |
math.factorial(n) |
n! | factorial(5) → 120 |
math.sin(x), cos, tan |
trigonometric ratios of x radians | sin(radians(30)) → 0.5 (rounded) |
math.log10(x) |
logarithm to base 10 | log10(1000) → 3.0 |
math.gcd(a, b) |
highest common factor | gcd(84, 120) → 12 |
Problem. Use the math module for the calculations in the table.
Solution.
import math

print("Square root of 256:", math.sqrt(256))
print("2 to the power 10:", math.pow(2, 10))
print("pi =", math.pi)
print("Ceil of 4.2:", math.ceil(4.2), " Floor of 4.8:", math.floor(4.8))
print("5! =", math.factorial(5))
print("sin 30 degrees =", round(math.sin(math.radians(30)), 2))
print("log10(1000) =", math.log10(1000))
print("HCF of 84 and 120 =", math.gcd(84, 120))
Square root of 256: 16.0
2 to the power 10: 1024.0
pi = 3.141592653589793
Ceil of 4.2: 5  Floor of 4.8: 4
5! = 120
sin 30 degrees = 0.5
log10(1000) = 3.0
HCF of 84 and 120 = 12
The random module
The random module produces pseudo-random numbers for games, quizzes,
simulations and sampling.
| Function | Returns | Note |
|---|---|---|
random.random() |
a float from 0.0 up to (not including) 1.0 | |
random.randint(a, b) |
an integer from a to b | both a and b can occur |
random.randrange(start, stop, step) |
an integer from the range | stop itself is never chosen |
random.choice(seq) |
one item of a list, tuple or string | |
random.shuffle(list) |
nothing; it mixes the list in place | |
random.sample(seq, k) |
a list of k different items |
Problem. Show each random function. Make the output repeatable so that it can be checked.
Solution. random.seed() fixes the starting point of the generator; the
same seed always gives the same sequence. Remove the seed line and every run
gives different numbers.
import random

random.seed(2083)
print(random.random())
print(random.randint(1, 6))
print(random.randrange(0, 100, 5))
print(random.choice(["Ram", "Sita", "Hari", "Gita"]))
cards = [1, 2, 3, 4, 5]
random.shuffle(cards)
print(cards)
print(random.sample(range(1, 51), 5))
0.9924157859181911
6
95
Ram
[5, 4, 2, 3, 1]
[4, 45, 12, 21, 10]
The datetime module
The datetime module works with dates and times: date(year, month, day)
makes a date, date.today() and datetime.now() give the current date and
time, subtracting two dates gives a timedelta (a length of time) whose
.days is a number of days, and strftime() formats a date as text (%d day,
%m month number, %B month name, %Y year, %A weekday, %I:%M %p time).
Problem. A student was born on 12 March 2010. On 14 April 2026 (1 Baisakh 2083 BS), how many days old is she and what is her age? What date is 100 days later?
Solution. Fixed dates are used so that the output can be checked; replace
date(2026, 4, 14) with date.today() to use the real current date.
from datetime import date, datetime, timedelta

dob = date(2010, 3, 12)
today = date(2026, 4, 14)          # 1 Baisakh 2083 BS
print("Date of birth:", dob)
print("Year:", dob.year, "Month:", dob.month, "Day:", dob.day)
print(dob.strftime("%d %B %Y, a %A"))

age_days = (today - dob).days
print("Days lived:", age_days)
years = today.year - dob.year - ((today.month, today.day) < (dob.month, dob.day))
print("Age in years:", years)

later = today + timedelta(days=100)
print("100 days after New Year 2083:", later.strftime("%d-%m-%Y"))

moment = datetime(2026, 4, 14, 10, 30, 0)
print(moment.strftime("%I:%M %p on %d/%m/%Y"))
Date of birth: 2010-03-12
Year: 2010 Month: 3 Day: 12
12 March 2010, a Friday
Days lived: 5877
Age in years: 16
100 days after New Year 2083: 23-07-2026
10:30 AM on 14/04/2026
The comparison (today.month, today.day) < (dob.month, dob.day) is True (1)
when this year's birthday has not yet come, so one year is subtracted. Python's
datetime uses the AD calendar; Bikram Sambat dates need a separate converter.
pip — installing packages
pip (the "package installer for Python") downloads and installs third-party packages from the Python Package Index (PyPI). It is run in the Command Prompt or terminal, not inside Python:
| Command | What it does |
|---|---|
pip install pandas |
installs pandas and the packages it needs |
pip install matplotlib seaborn |
installs several packages at once |
pip list |
lists every installed package with its version |
pip show pandas |
shows details of one package |
pip install --upgrade pandas |
updates a package |
pip uninstall pandas |
removes a package |
If pip is "not recognized" on Windows, use py -m pip install pandas. Part
of the real output of pip show pandas:
Name: pandas
Version: 2.3.3
Summary: Powerful data structures for data analysis, time series, and statistics
Home-page: https://pandas.pydata.org
Requires: numpy, python-dateutil, pytz, tzdata
The line Requires shows why pip is useful: installing pandas also installed NumPy and the other packages pandas depends on.
4.4 Graphics using Turtle
The turtle module draws pictures by moving a small cursor — the turtle — around a window. It comes from the Logo language, created in 1967 for teaching children, in which a real robot "turtle" with a pen crawled over paper. Turtle graphics turn loops, functions and angles into pictures, so mistakes are easy to see and patterns easy to create.

The turtle starts at the centre of the window, the point (0, 0), facing
east (heading 0°). Positive x is to the right and positive y is up; in the
standard mode left() turns anticlockwise and right() clockwise. The drawing
appears in its own window (made with Tk), not in the terminal.
| Method | Short form | What it does |
|---|---|---|
forward(d) |
fd(d) |
moves d steps in the direction it faces, drawing if the pen is down |
backward(d) |
bk(d), back(d) |
moves d steps backwards without turning |
right(a) |
rt(a) |
turns clockwise by a degrees, without moving |
left(a) |
lt(a) |
turns anticlockwise by a degrees |
goto(x, y) |
setpos(x, y) |
moves straight to the point (x, y) |
setheading(a) |
seth(a) |
faces direction a (0 east, 90 north, 180 west, 270 south) |
penup() / pendown() |
pu() / pd() |
lifts the pen (moves without drawing) / puts it down |
pensize(w) |
width(w) |
sets the thickness of the line |
color(c) |
sets the pen (and fill) colour: a name or "#RRGGBB" |
|
pencolor(c), fillcolor(c) |
sets only the line colour / only the fill colour | |
begin_fill() … end_fill() |
fills the shape drawn between the two calls | |
circle(r) |
draws a circle of radius r, centre r steps to the turtle's left | |
shape(name) |
cursor shape: "arrow", "turtle", "circle", "square", "triangle", "classic" | |
speed(n) |
1 slowest … 10 fast, 0 fastest | |
hideturtle() |
ht() |
hides the cursor |
done() / mainloop() / exitonclick() |
keeps the window open (the last until it is clicked) |
To draw a regular polygon with n sides, the turtle must turn through the exterior angle 360° ÷ n at each corner: 120° for a triangle, 90° for a square, 60° for a hexagon. A five-pointed star needs turns of 144°, because the turtle goes round the centre twice (5 × 144° = 720°).
Problem. Draw (a) a square of side 50, (b) a red triangle and a blue
hexagon using one polygon() function, and (c) a red five-pointed star.
Solution.
(a)
import turtle
s = turtle.Turtle()
for i in range(4):
    s.forward(50)
    s.right(90)
turtle.done()
(b)
import turtle

def polygon(t, sides, length, colour):
    t.pencolor(colour)
    for i in range(sides):
        t.forward(length)
        t.left(360 / sides)

pen = turtle.Turtle()
pen.pensize(2)
polygon(pen, 3, 100, "red")
pen.penup()
pen.goto(150, 0)
pen.pendown()
polygon(pen, 6, 60, "blue")
turtle.done()
(c)
import turtle
t = turtle.Turtle()
t.color("red")
t.pensize(2)
for i in range(5):
    t.forward(150)
    t.right(144)
t.hideturtle()
turtle.done()
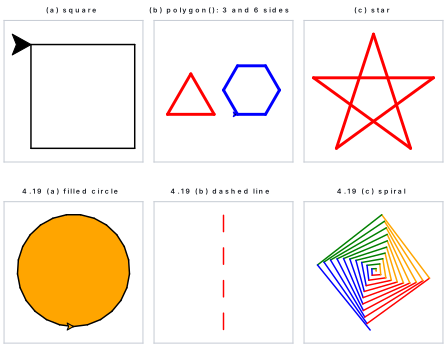
The outputs are the first three drawings of the figure below. Because (a) turns right, the square is drawn below the starting point; because (b) turns left, the triangle and hexagon are drawn above it.
Problem. Draw (a) a circle of radius and colour typed by the user, filled with that colour, (b) a dashed vertical line, and (c) a coloured square spiral.
Solution.
(a)
import turtle
t = turtle.Turtle()
r = int(input("Enter the radius of the circle: "))
col = input("Enter the colour name or hex value (#RRGGBB): ")
t.fillcolor(col)
t.begin_fill()
t.circle(r)
t.end_fill()
turtle.done()
(b)
import turtle
turtle.color("red")
turtle.hideturtle()
turtle.speed(1)
turtle.left(90)
for i in range(4):
    turtle.forward(30)
    turtle.penup()
    turtle.forward(30)
    turtle.pendown()
turtle.exitonclick()
(c)
import turtle
t = turtle.Turtle()
t.speed(0)
colours = ["red", "orange", "green", "blue"]
for i in range(40):
    t.pencolor(colours[i % 4])
    t.forward(i * 5)
    t.left(91)
t.hideturtle()
turtle.done()
For (a) the user typed 80 and orange. circle(80) actually draws a 25-sided
polygon so close to a circle that the eye cannot tell. In (b) each pass draws
30 steps, lifts the pen for 30 steps and puts it down again, so four dashes
appear. In (c) every line is 5 steps longer than the last and every turn is
91°, one degree more than a square, so each square is slightly rotated.
The textbook's shape() example draws six sides of a hexagon with
right(60) turns and changes the cursor each time — "circle", "triangle",
"square", "arrow" and finally "turtle". shape() changes only how the cursor
looks; the line drawn is the same.
right(30) does not move the turtle 30 steps to the right; it turns it 30°
clockwise on the spot. Only forward(), backward() and goto() move it. A
square drawn with left(90) in place of right(90) is the same size but sits
above the starting point instead of below it.
4.5 Error handling: errors, exceptions and try-except
An error (bug) is a mistake that stops a program from working or makes it give a wrong answer. There are three kinds.
Syntax errors break the grammar of Python — a missing colon, an unclosed bracket, wrong indentation, a misspelt keyword. Python finds them before running anything and runs no part of the program:
age = 16
if age >= 16
    print("You can apply for citizenship.")
  File "citizen.py", line 2
    if age >= 16
                ^
SyntaxError: expected ':'
Leaving out the indentation of the print line instead gives
IndentationError: expected an indented block after 'if' statement on line 2.
Runtime errors (exceptions) happen while a grammatically correct program runs, when it meets something impossible: dividing by zero, turning "abc" into a number, opening a missing file. Python stops and prints a traceback naming the exception:
numerator = int(input("Enter numerator: "))
denominator = int(input("Enter denominator: "))
result = numerator / denominator
print(f"Result: {result}")
Enter numerator: 10
Enter denominator: 0
Traceback (most recent call last):
  File "divide.py", line 3, in <module>
    result = numerator / denominator
             ~~~~~~~~~~^~~~~~~~~~~~~
ZeroDivisionError: division by zero
| Exception | Raised when | Example that causes it |
|---|---|---|
ZeroDivisionError |
dividing by zero | 10 / 0 |
ValueError |
a value has the right type but a wrong content | int("abc") → invalid literal for int() with base 10: 'abc' |
TypeError |
an operation gets the wrong type | "Age: " + 15 → can only concatenate str (not "int") to str |
NameError |
a name is not defined | using message outside its function |
IndexError |
a list index is out of range | [78, 92, 65][3] |
FileNotFoundError |
opening a missing file for reading | open("results.txt", "r") |
Logical errors produce no message at all: the program runs and prints a wrong answer because the logic is wrong. Only testing with values whose answer you know will reveal them.
first = 60
second = 80
average = first + second / 2
print("Wrong average:", average)
average = (first + second) / 2
print("Correct average:", average)
Wrong average: 100.0
Correct average: 70.0
Division is done before addition, so the first formula computes 60 + 40.
Handling exceptions with try, except, else and finally
Exceptions can be caught so that the program shows a helpful message instead of crashing. Code that might fail goes in a try block. If an exception happens there, Python jumps to the matching except block. The optional else block runs only when the try block raised no exception, and the optional finally block always runs, error or not, and is used for clean-up such as closing files.
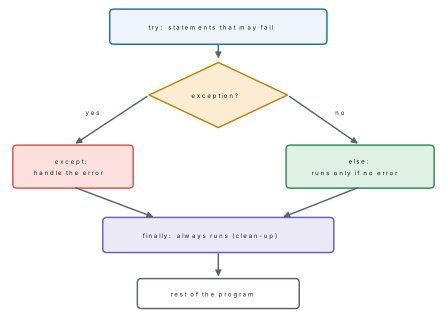
Problem. Divide two whole numbers typed by the user, handling non-numbers and division by zero, and always thank the user.
Solution.
try:
    a = int(input("Enter a number: "))
    b = int(input("Enter another number: "))
    result = a / b
except ValueError:
    print("Please enter whole numbers only.")
except ZeroDivisionError:
    print("A number cannot be divided by zero.")
else:
    print("Result:", result)
finally:
    print("Thank you for using the calculator.")
Three runs:
Enter a number: 20
Enter another number: 4
Result: 5.0
Thank you for using the calculator.
Enter a number: 20
Enter another number: 0
A number cannot be divided by zero.
Thank you for using the calculator.
Enter a number: twenty
Please enter whole numbers only.
Thank you for using the calculator.
Problem. Read marks between 0 and 100, asking again after any invalid entry.
Solution. A while True loop repeats until break is reached.
while True:
    try:
        marks = int(input("Enter marks (0-100): "))
        if 0 <= marks <= 100:
            break
        print("Marks must be between 0 and 100.")
    except ValueError:
        print("That is not a whole number. Try again.")
print("Marks accepted:", marks)
Enter marks (0-100): abc
That is not a whole number. Try again.
Enter marks (0-100): 150
Marks must be between 0 and 100.
Enter marks (0-100): 76
Marks accepted: 76
A bare except: or except Exception as e: catches every kind of exception;
e then holds the error message. Catching specific exceptions is better,
because a general except can hide real bugs.
In everyday speech any mistake is an "error". In Python, an exception is an error detected while the program runs, which the program can catch with try-except and recover from. A syntax error can never be caught by the program itself, because the program never starts.
4.6 File handling: text files, and CSV files with pandas
Variables live in RAM and vanish when a program ends. To keep data — marks,
records, settings — after the program closes, it must be saved in a file on
the disk. File handling means creating, opening, reading, writing,
appending and closing files from a program. Python works with text files
(characters in lines, such as .txt and .csv) and binary files (images,
sound, programs); this unit uses text files.
| Benefits of file handling | Difficulties |
|---|---|
| data is stored permanently | wrong mode or path causes errors |
| large amounts of data can be read and processed automatically | a careless program can overwrite or expose important files |
| works with many formats: text, CSV, Excel, JSON | complex formats need extra libraries |
| the same code works on Windows, macOS and Linux | very large files can be slow to process |
Opening and closing files
file = open("filename.txt", "mode")
...
file.close()
or, better, with the with statement, which closes the file automatically even if an error happens:
with open("filename.txt", "mode") as file:
    ...
| Mode | Meaning | If the file exists | If it does not exist |
|---|---|---|---|
"r" |
read (the default) | reads from the start | FileNotFoundError |
"w" |
write | erases it and writes from the start | creates it |
"a" |
append | adds new data at the end | creates it |
"x" |
exclusive create | FileExistsError | creates it |
"r+" |
read and write | reads and writes; nothing erased | FileNotFoundError |
"w+" |
write and read | erases it first | creates it |
"a+" |
append and read | writes only at the end | creates it |
Adding b (as in "rb") opens a binary file. The textbook announces "six
different access modes" but its table lists only r, w and a; the full set is
above.
Reading and writing
| Method | What it does |
|---|---|
f.read() |
the whole file as one string |
f.read(n) |
the next n characters |
f.readline() |
the next line, including its \n |
f.readlines() |
all remaining lines as a list of strings |
for line in f: |
visits the lines one at a time |
f.write(s) |
writes the string s exactly as given |
f.writelines(list) |
writes every string of a list, one after another |
f.close() |
closes the file and frees it for other programs |
The textbook says write() "will add a single line at a time". It writes
exactly the string you give it — no more. f.write("Ram") followed by
f.write("Sita") stores RamSita. End each line yourself with "\n", and
give writelines() strings that already end in "\n".
Problem. Create message.txt with two lines and display its contents.
Solution.
file = open("message.txt", "w")
file.write("Hello, welcome to file handling in Python!\n")
file.write("This is the second line.\n")
file.close()

file = open("message.txt", "r")
content = file.read()
print(content)
file.close()
Hello, welcome to file handling in Python!
This is the second line.
The blank last line appears because the file already ends with \n and
print() adds one more.
Problem. (a) Store the name and class of three students in student.txt;
(b) display the file; (c) append one more student and display it again.
Solution. Three separate programs.
(a)
file = open("student.txt", "w")
for i in range(3):
    name = input("Enter name of student: ")
    clas = input("Enter class of student: ")
    file.write(name + "," + clas + "\n")
file.close()
print("Data written to student.txt")
Enter name of student: Aarosh
Enter class of student: 10
Enter name of student: Nidhi
Enter class of student: 9
Enter name of student: Rajesh
Enter class of student: 10
Data written to student.txt
(b)
file = open("student.txt", "r")
print("Contents of student.txt:")
for line in file:
    print(line.strip())
file.close()
(c)
file = open("student.txt", "a")
name = input("Enter name of new student: ")
clas = input("Enter class of new student: ")
file.write(name + "," + clas + "\n")
file.close()
print("Data added to student.txt")
After appending Muna of Class 10, program (b) prints:
Contents of student.txt:
Aarosh,10
Nidhi,9
Rajesh,10
Muna,10
strip() removes the \n at the end of each line; without it every record
would be followed by a blank line. The variable is called clas because
class is a Python keyword.
Problem. Show what read(10), readline() and readlines() return one
after another, and what happens with modes x and r.
Solution. The file remembers how far it has been read (the file pointer), so each method continues from where the last one stopped.
with open("student.txt", "r") as f:
    print(repr(f.read(10)))
    print(repr(f.readline()))
    print(f.readlines())
print("Closed?", f.closed)

try:
    f = open("student.txt", "x")
except FileExistsError:
    print("x mode: student.txt already exists, so it was not touched")
try:
    f = open("results.txt", "r")
except FileNotFoundError as e:
    print("r mode:", e)
'Aarosh,10\n'
'Nidhi,9\n'
['Rajesh,10\n', 'Muna,10\n']
Closed? True
x mode: student.txt already exists, so it was not touched
r mode: [Errno 2] No such file or directory: 'results.txt'
repr() shows the hidden \n characters. The first line happens to be
exactly 10 characters long, so read(10) returns all of it.
CSV files
A CSV (Comma-Separated Values) file is a plain-text table: the first line usually holds the column names, and each following line is one record with its values separated by commas.
Name,Marks
Aarosh,78
Subigya,92
Binay,65
CSV is the commonest way to move data between spreadsheets (Excel, Google Sheets), databases and programs, because it is plain text, simple, small and understood by almost every program and language.
Python's built-in csv module reads and writes CSV row by row, with no
installation; open the file with newline="" when writing, so that Windows
does not add blank lines.
Problem. Create students.csv with columns Name and Marks and three
records, then display it.
Solution.
import csv

with open("students.csv", "w", newline="") as f:
    writer = csv.writer(f)
    writer.writerow(["Name", "Marks"])
    writer.writerows([["Aarosh", 78], ["Subigya", 92], ["Binay", 65]])
print("students.csv created")

with open("students.csv", "r") as f:
    reader = csv.reader(f)
    for row in reader:
        print(row)
students.csv created
['Name', 'Marks']
['Aarosh', '78']
['Subigya', '92']
['Binay', '65']
The csv module returns every value as a string ('78', not 78).
CSV files with pandas
pandas is a library for working with tables of data. It reads a whole CSV
file into a DataFrame — a table with labelled columns and a numbered
index — in one line, and gives easy tools to select, filter, sort, summarise
and save the data. Install it once with pip install pandas; import it with
import pandas as pd.
| Code | What it does |
|---|---|
pd.DataFrame(data) |
makes a DataFrame from a dictionary or a list of lists (with columns=[...]) |
pd.read_csv("file.csv") |
reads a CSV file into a DataFrame (sep=";" for another separator) |
df.head(n), df.tail(n) |
first or last n rows (5 by default) |
df.shape |
(number of rows, number of columns) |
df.columns |
the column (field) names |
df.info() |
column names, types and missing values |
df["Marks"] or df.Marks |
one column |
df[["Name", "Marks"]] |
several columns |
df["Marks"].mean(), .max(), .min(), .sum() |
statistics of a column |
df[df["Marks"] > 80] |
rows that satisfy a condition |
df.sort_values("Marks", ascending=False) |
rows sorted by a column |
df.to_csv("file.csv", index=False) |
saves the DataFrame as CSV without the index |
Problem. Make a DataFrame from a dictionary; then make one from a list of
lists and save it as Stu_data.csv.
Solution.
import pandas as pd

data = {"Name": ["Shyam", "Sanskar"], "Age": [25, 30]}
df = pd.DataFrame(data)
print(df)

header = ["Name", "M1 Score", "M2 Score"]
rows = [["Sanskar", 62, 80], ["Sambriddhi", 45, 56], ["Aurora", 85, 98]]
scores = pd.DataFrame(rows, columns=header)
scores.to_csv("Stu_data.csv", index=False)
print(open("Stu_data.csv").read())
      Name  Age
0    Shyam   25
1  Sanskar   30
Name,M1 Score,M2 Score
Sanskar,62,80
Sambriddhi,45,56
Aurora,85,98
The numbers 0 and 1 at the left are the index. index=False keeps it out of
the CSV file.
The next examples read result.csv, which holds eight students' marks:
Symbol No,Name,Gender,English,Nepali,Maths,Computer
1001,Aarosh,M,72,68,81,88
1002,Subigya,F,85,79,90,94
1003,Binay,M,64,70,58,91
1004,Nidhi,F,78,82,75,86
1005,Aman,M,55,61,49,72
1006,Anjali,F,90,88,92,97
1007,Rajesh,M,81,74,86,84
1008,Muna,F,69,77,63,79
Problem. Read result.csv; show the first five rows, its size, its column
names and the average Computer mark; list the boys who scored more than 85 in
Computer; add a Total column and show the top three.
Solution.
import pandas as pd

df = pd.read_csv("result.csv")
print(df.head())
print("Shape:", df.shape)
print("Columns:", list(df.columns))
print("Average in Computer:", df["Computer"].mean())

boys = df[(df["Gender"] == "M") & (df["Computer"] > 85)]
print(boys[["Name", "Computer"]])

df["Total"] = df["English"] + df["Nepali"] + df["Maths"] + df["Computer"]
top = df.sort_values("Total", ascending=False)
print(top[["Name", "Total"]].head(3))
   Symbol No     Name Gender  English  Nepali  Maths  Computer
0       1001   Aarosh      M       72      68     81        88
1       1002  Subigya      F       85      79     90        94
2       1003    Binay      M       64      70     58        91
3       1004    Nidhi      F       78      82     75        86
4       1005     Aman      M       55      61     49        72
Shape: (8, 7)
Columns: ['Symbol No', 'Name', 'Gender', 'English', 'Nepali', 'Maths', 'Computer']
Average in Computer: 86.375
     Name  Computer
0  Aarosh        88
2   Binay        91
      Name  Total
5   Anjali    367
1  Subigya    348
6   Rajesh    325
To combine conditions on columns write & (and) or | (or), and put each
condition in its own brackets: df[(df["Gender"] == "M") & (df["Computer"] > 85)].
Writing and, or leaving out the brackets, raises an error.
Problem. employee.csv stores Name, Address, Gender and Salary. Show the
employees who earn more than 75,000, and count those earning more than 50,000.
Solution.
import pandas as pd

df = pd.read_csv("employee.csv")
print("Employees with salary more than 75,000:")
print(df[df["Salary"] > 75000])
print("Employees with salary more than 50,000:", len(df[df["Salary"] > 50000]))
With six employees in the file, the output was:
Employees with salary more than 75,000:
           Name    Address Gender  Salary
0    Hari Thapa  Kathmandu      M   82000
3  Laxmi Gurung    Pokhara      F   91000
5    Anita Shah    Birgunj      F   77500
Employees with salary more than 50,000: 5
4.7 Introduction to data visualization with Matplotlib
Data visualization means showing data as charts and graphs so that patterns, trends, comparisons and unusual values can be seen at a glance. A table of 1,000 marks says little; a chart of them shows at once which subject is weakest and whether results are improving. Businesses, scientists, journalists and governments rely on charts to understand data and to explain decisions.
| Library | Strength | Install |
|---|---|---|
| Matplotlib | the basic plotting library: line, bar, pie, scatter, histogram; full control, more code | pip install matplotlib |
| Seaborn | built on Matplotlib; attractive statistical charts with less code, works well with pandas | pip install seaborn |
| Plotly | interactive charts you can zoom, hover and click, shown in a web browser | pip install plotly |
Matplotlib was created by John D. Hunter in 2003. Its pyplot module is
imported as import matplotlib.pyplot as plt. Every chart follows the same
pattern: make the chart (plt.plot, plt.bar, plt.pie, plt.scatter),
label it (plt.title, plt.xlabel, plt.ylabel, plt.legend,
plt.grid), then display it (plt.show()) or save it
(plt.savefig("chart.png")).
| Chart | Function | Best for |
|---|---|---|
| Line chart | plt.plot(x, y) |
change over time (trends) |
| Bar chart | plt.bar(categories, values) (plt.barh for horizontal) |
comparing categories |
| Pie chart | plt.pie(values, labels=..., autopct="%1.1f%%") |
parts of a whole, as percentages |
| Scatter plot | plt.scatter(x, y) |
the relationship between two quantities |
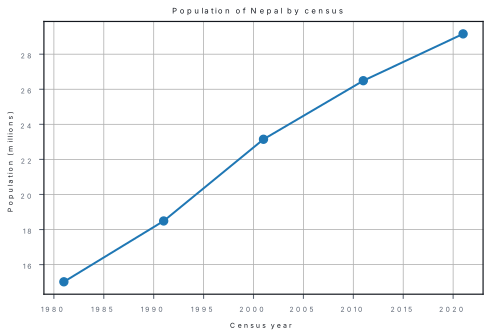
Problem. Draw a line chart of Nepal's population at the last five censuses: 15.02, 18.49, 23.15, 26.49 and 29.16 million in 1981, 1991, 2001, 2011 and 2021.
Solution.
import matplotlib.pyplot as plt

years = [1981, 1991, 2001, 2011, 2021]
population = [15.02, 18.49, 23.15, 26.49, 29.16]   # millions, from the census

plt.plot(years, population, marker="o")
plt.title("Population of Nepal by census")
plt.xlabel("Census year")
plt.ylabel("Population (millions)")
plt.grid(True)
plt.show()
marker="o" puts a dot on each data point and plt.grid(True) adds grid
lines. The chart shows the population rising every decade, but more slowly
after 2001: the line bends.
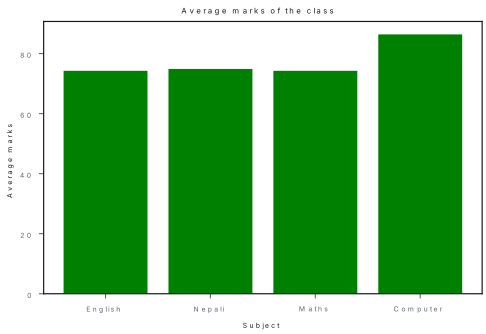
Problem. Read result.csv with pandas and draw a bar chart of the class
average in each subject.
Solution.
import pandas as pd
import matplotlib.pyplot as plt

df = pd.read_csv("result.csv")
subjects = ["English", "Nepali", "Maths", "Computer"]
averages = [df[s].mean() for s in subjects]
for s, a in zip(subjects, averages):
    print(s, round(a, 2))

plt.bar(subjects, averages, color="green")
plt.title("Average marks of the class")
plt.xlabel("Subject")
plt.ylabel("Average marks")
plt.show()
English 74.25
Nepali 74.88
Maths 74.25
Computer 86.38
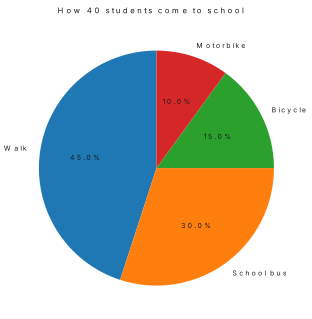
Problem. Of 40 students, 18 walk to school, 12 come by school bus, 6 by bicycle and 4 by motorbike. Draw a pie chart with percentages.
Solution.
import matplotlib.pyplot as plt

modes = ["Walk", "School bus", "Bicycle", "Motorbike"]
students = [18, 12, 6, 4]

plt.pie(students, labels=modes, autopct="%1.1f%%", startangle=90)
plt.title("How 40 students come to school")
plt.show()
autopct="%1.1f%%" writes each slice's percentage with one decimal place
(18 ÷ 40 = 45.0 %), and startangle=90 starts the first slice at the top.
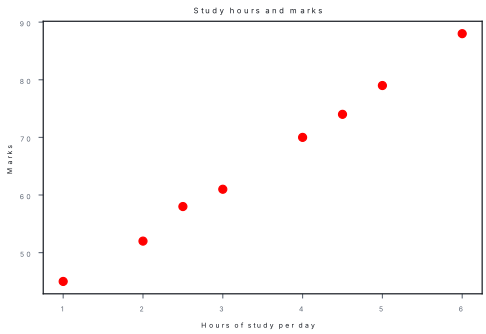
Problem. Plot the marks of eight students against their daily hours of study: hours 1, 2, 2.5, 3, 4, 4.5, 5, 6 and marks 45, 52, 58, 61, 70, 74, 79, 88.
Solution.
import matplotlib.pyplot as plt

hours = [1, 2, 2.5, 3, 4, 4.5, 5, 6]
marks = [45, 52, 58, 61, 70, 74, 79, 88]

plt.scatter(hours, marks, color="red")
plt.title("Study hours and marks")
plt.xlabel("Hours of study per day")
plt.ylabel("Marks")
plt.show()
The dots rise from left to right: in this group, more study goes with higher marks.
Seaborn and Plotly
The same data can be charted with the other two libraries; both programs below
were run on result.csv.
import pandas as pd
import seaborn as sns
import matplotlib.pyplot as plt

df = pd.read_csv("result.csv")
sns.barplot(x="Name", y="Computer", hue="Gender", data=df)
plt.title("Computer marks of each student")
plt.show()
import pandas as pd
import plotly.express as px

df = pd.read_csv("result.csv")
fig = px.bar(df, x="Name", y="Computer", color="Gender", title="Computer marks of each student")
fig.show()
Seaborn draws a coloured bar chart in one call, with a legend for the hue
column. Plotly opens the chart in a web browser, where hovering over a bar shows
its exact value and the chart can be zoomed; the color argument colours the
bars by gender and adds a legend.
In plt.bar(data['total_bill'], data['day']) the categories should come
first and the numbers second: plt.bar(data['day'], data['tip']). The x-axis
label should then be "Day" and the y-axis label "Tip", as the textbook's labels
already say.
Textbook exercises: model answers
The textbook has an exercise after each part of this unit; all five are answered here, followed by its practical questions. Where a full program already appears in the chapter, the answer names it.
Exercise after 4.1 (revision)
i. (b) — print() displays output.
ii. (c) — Python has no separate "character" type; a single letter is a str.
iii. (d) — Boolean values are True or False.
iv. (c) — == compares two values.
v. (c) — and is True only if both conditions are True.
vi. (c) — if runs a block only when its condition is True.
vii. (d) — if-elif-else checks several conditions in turn.
viii. (b) — repeating code is iteration.
ix. (b) — for is used when the number of repetitions is known.
x. (c) — square brackets make a list.
a. input() displays a prompt, waits for the user to type and press Enter,
and returns what was typed as a string.
b. "Bhaktapur1" (any text in quotes).
c. An identifier is the name of a variable, function or other object; it
uses letters, digits and _, cannot start with a digit or be a keyword, and is
case-sensitive.
d. / gives the exact quotient as a float (9 / 2 = 4.5); // gives the
quotient rounded down to a whole number (9 // 2 = 4).
e. A data type is the kind of value a variable holds — int, float, str, bool, list — which decides what can be done with it.
f. Relational operators compare two values and give True or False, e.g.
7 > 5 is True.
g. The else block runs when the if condition is False.
h. A nested if is an if statement written inside another if (or else)
block; see Program 4.4.
i. Use for when the number of repetitions is known or when going through
a list or range; use while when the loop must continue until a condition
changes.
j. range() produces the sequence of integers a for loop runs over:
range(start, stop, step), stopping before stop.
k. A list stores several values in one variable, in order, inside square
brackets: marks = [78, 92, 65].
l. Iteration is repeating a set of statements while a condition holds or a
fixed number of times, using for or while loops, e.g. printing a
multiplication table.
a. Arithmetic operators calculate: + - * / % ** //, e.g. 17 % 5 is 2.
Relational operators compare and give True or False: == != > < >= <=, e.g.
3 != 5 is True. Logical operators combine conditions: and, or, not,
e.g. (age >= 16) and (age < 18). (Table and Program 4.2 in §4.1.)
b. if runs a block only when a condition is True; if-else runs one block
when it is True and another when it is False; if-elif-else tests several
conditions in order and runs the first True block, with else for none
(syntax and Programs 4.3, 4.4 in §4.1).
c. for variable in sequence: repeats once per item — Program 4.5 prints a
table. while condition: repeats while the condition is True — Program 4.6
adds digits until the number becomes 0.
d. int (whole numbers, 25), float (decimals, 3.14), str (text,
"Nepal"), bool (True/False). The type decides which operations are allowed
("15" + 1 is an error) and how input must be converted (int(input())), so
understanding types prevents errors.
e–f. The program is Program 4.4 in §4.1; with 7 it prints Positive and Odd, with −4 Negative, with 0 Zero.
Exercise after 4.2 (functions)
i. (c) — def defines a function.
ii. (b) — values passed in a call are arguments.
iii. (d) — where a name can be used is its scope.
iv. (b) — variables made inside a function are local.
v. (c) — return sends a value back to the caller.
vi. (b) — names in the header are parameters.
vii. (c) — keyword arguments are passed as name=value.
viii. (b) — a function that returns no value is a void function.
ix. (c) — return a, b returns a tuple.
a. Code is written once and reused; programs become modular, shorter and easier to read, test and correct.
b. Built-in functions and user-defined functions.
c. A parameter is the name in the function header (def area(r)); an
argument is the value passed in the call (area(7)).
d. A local variable is created inside a function and can be used only
there, e.g. message in Program 4.12.
e. A global variable is created outside all functions and can be read anywhere; a local one exists only inside its function while it runs.
f. return ends the function and sends a value back to the place where it
was called.
g. Positional arguments are matched to parameters by their order:
interest(20000, 2, 10) gives prin = 20000, time = 2, rate = 10.
h. When a parameter usually has the same value, e.g. a 10 % interest rate, a default lets the caller leave it out.
i. Keyword arguments name the parameter (rate=8), so they can be given in
any order and the call is easier to read.
j. The function stops at that return and gives back None.
a. Scope decides where a variable can be used. Local variables, created
inside a function, exist only during the call; global variables, created
outside, can be read everywhere. Program 4.12 shows school (global) used
inside a function and message (local) failing with NameError outside it.
b. A non-void function returns a value (area_circle in Program 4.10),
which the caller can print, store or use in an expression. A void function only
does a task (greet in Program 4.11) and returns None.
c. Write the values after return separated by commas; Python returns them
as one tuple, which the caller can keep (result = square_and_cube(4) gives
(16, 64)) or unpack (sq, cb = square_and_cube(5)), as in Program 4.11.
d.
def product(a, b):
    return a * b

def show_numbers(numbers):
    for n in numbers:
        print(n, end=" ")
    print()

def largest(numbers):
    big = numbers[0]
    for n in numbers:
        if n > big:
            big = n
    return big

print("Product:", product(12, 7))
values = [34, 89, 12, 67, 45]
show_numbers(values)
print("Largest:", largest(values))
Product: 84
34 89 12 67 45
Largest: 89
Exercise after 4.3–4.5 (libraries and errors)
i. (c) — a library is a collection of modules for one kind of need.
ii. (c) — pandas manipulates and analyses data.
iii. (c) — the textbook's answer is "package". (Strictly a module holds functions and a package holds modules.)
iv. (c) — import brings in a module.
v. (d) — "get … from …" is not Python. (Option (b), as printed with "get", is also invalid; the real form is from module import function.)
vi. (b) — random generates random numbers.
vii. (c) — breaking the grammar is a syntax error.
viii. (c) — errors detected while running are exceptions.
ix. (c) — code is tested inside try.
x. (b) — finally always runs.
a. A module is a Python file of functions, variables and classes that other
programs can import, e.g. math.
b. A library is a collection of many modules (often grouped in packages); modules are its building blocks.
c. math — mathematical functions such as sqrt() and constants such as
pi.
d. Packages group related modules in folders, so large code is organised, names do not clash, and the same code can be reused in many programs.
e. An alias gives a long module name a short one: import pandas as pd,
then pd.read_csv(...).
f. math.sqrt() and math.factorial() (also pow, ceil, floor).
g. An error that happens while the program runs, e.g. dividing by a denominator the user enters as 0 (ZeroDivisionError).
h. "Error" is any mistake; an exception is an error detected during running, which the program can catch with try-except. Syntax errors stop the program before it runs and cannot be caught by it.
i. The except block runs when the matching exception occurs in the try block, handling it (for example with a message) instead of crashing.
j. When the try block finishes without any exception.
a. A module is a file of reusable code, a package a folder of related modules, and a library a large collection of them for one purpose. They provide tested ready-made code (saving time), avoid rewriting common tasks, organise big programs, and give access to powerful tools — pandas for data, Matplotlib for charts, Turtle for graphics. Standard modules come with Python; others are installed with pip.
b. pandas handles tables of data: pd.read_csv("result.csv") then
df.head() (Program 4.27). Turtle draws graphics with a moving cursor:
forward(50) and right(90) four times draw a square (Program 4.18).
Matplotlib draws charts: plt.bar(subjects, averages) then plt.show()
(Program 4.30).
c. A syntax error (missing colon) stops the program from running at all.
A runtime error (10 / 0, int("abc")) stops it in the middle with a
traceback, losing work. A logical error (first + second / 2 for an
average) runs but gives wrong results, which is the most dangerous because
nothing warns you (examples in §4.5).
d. Error handling stops programs from crashing on bad input or missing
files, shows users helpful messages, lets the program recover or ask again
(Program 4.21), ensures clean-up in finally, and makes programs reliable
enough for real users.
Exercise after 4.6 (file handling)
i. (c) — pandas simplifies structured data such as CSV.
ii. (c) — pd.read_csv() reads a CSV file.
iii. (b) — sep (pandas also accepts delimiter as another name for it).
iv. (b) — df.columns gives the field names.
v. (c) — df.to_csv() writes a CSV file.
vi. (c) — index=False leaves the index column out.
vii. (c) — the default separator is a comma.
viii. (c) — "r" reads.
ix. (c) — "w" creates or overwrites.
x. (c) — pd.DataFrame() makes a DataFrame.
i. Reading or writing a whole table takes one line; columns can be selected, filtered, sorted and summarised easily; many formats (CSV, Excel, JSON) are supported; it handles large data quickly.
ii. A CSV file is plain text where each line is a record and values are separated by commas, with column names in the first line. It is common because it is simple, small and readable by spreadsheets, databases and every programming language.
iii. Install pandas (pip install pandas) and import it with
import pandas as pd.
iv. df = pd.read_csv("file_name.csv"), with sep=";" if another separator
is used.
v. df["Salary"] (or df.Salary) gives the Salary column; e.g.
print(df["Salary"].mean()).
vi. df.to_csv("file_name.csv", index=False).
vii. Python raises FileNotFoundError and stops, unless it is handled with
try-except.
viii. "w" erases any existing content and writes from the start; "a" keeps the content and adds new data at the end. Both create the file if it is missing.
ix. Closing saves any data still waiting in memory to the disk, frees the
file for other programs and releases system resources. pandas' read_csv()
and to_csv() open and close the file themselves; with open() use
close() or with.
i. Install pandas with pip; import it as pd; read the file with
pd.read_csv(); then inspect it with head(), shape, columns or
info().
import pandas as pd
df = pd.read_csv("result.csv")
print(df.head())
ii. With student_data.csv holding six students:
import pandas as pd

df = pd.read_csv("student_data.csv")
print(df.head(5))
print("Average age:", df["Age"].mean())
grade_a = df[df["Grade"] == "A"]
print(grade_a)
      Name  Age Grade
0   Aarosh   15     A
1  Subigya   16     A
2    Binay   15     B
3    Nidhi   14     A
4     Aman   16     C
Average age: 15.166666666666666
      Name  Age Grade
0   Aarosh   15     A
1  Subigya   16     A
3    Nidhi   14     A
Exercise after 4.7 (data visualization)
i. (c) — to understand data through visual context.
ii. (c) — Matplotlib draws basic line and bar charts.
iii. (c) — a scatter plot uses dots.
iv. (c) — a bar chart uses rectangular bars.
v. (c) — Seaborn is built on Matplotlib.
vi. (a) — scatter().
vii. (b) — px.line().
viii. (d) — plt.pie().
ix. (c) — px.bar().
a. Showing data as charts and graphs so that its patterns and meaning are easy to see.
b. Charts reveal trends, comparisons and problems in large data quickly, so managers make better decisions and explain them clearly.
c. Matplotlib, Seaborn and Plotly.
d. It is a low-level library: every part of a chart can be controlled, but more lines of code are needed.
e. Values of separate categories to be compared, e.g. marks in each subject.
f. Matplotlib; it focuses on attractive statistical charts with little code.
g. Plotly charts are interactive (hover, zoom, click) and shown in a browser.
h. They label the x-axis and the y-axis.
i. Parts of a whole, shown as percentages, e.g. shares of a budget.
j. It colours the bars, points or lines according to the values of a column (e.g. Gender) and adds a legend.
i. Visualization turns large tables into pictures, so trends (rising sales), comparisons (weakest subject), relationships (study time and marks) and outliers are seen at once; it speeds up analysis, supports decisions and communicates results to people who would not read the raw data.
ii.
| Point | Matplotlib | Plotly |
|---|---|---|
| Output | static images in a window or file | interactive charts in a browser |
| Interactivity | none by default | hover values, zoom, pan, click legend |
| Ease of use | more code, full control of every part | short code with plotly.express |
| Customisation | very detailed | good, through figure settings |
| Line, bar, pie | plt.plot, plt.bar, plt.pie |
px.line, px.bar, px.pie |
| Best for | printed reports, quick plots | dashboards and web pages |
iii. Import matplotlib.pyplot as plt; prepare lists of data; call
plt.plot(x, y) for a line chart, plt.bar(categories, values) for a bar
chart or plt.pie(values, labels=..., autopct="%1.1f%%") for a pie chart;
add plt.title, plt.xlabel and plt.ylabel; finish with plt.show().
Programs 4.29, 4.30 and 4.31 are complete examples.
iv. Group the data before plotting:
import pandas as pd
import matplotlib.pyplot as plt

df = pd.read_csv("monthly_sales.csv")

monthly = df.groupby("Month", sort=False)["Sales"].sum()
plt.plot(monthly.index, monthly.values, marker="o")
plt.title("Total sales by month")
plt.xlabel("Month")
plt.ylabel("Sales (Rs)")
plt.show()

category = df.groupby("Category")["Sales"].sum()
plt.bar(category.index, category.values)
plt.title("Total sales by category")
plt.show()

plt.pie(category.values, labels=category.index, autopct="%1.1f%%")
plt.title("Share of each category")
plt.show()
With nine rows of sample data (three months × three categories of a school shop), the monthly totals were Baisakh 60,000, Jestha 46,000 and Asar 31,000, and the category totals Books 66,000, Stationery 38,000 and Uniform 33,000: the line chart falls month by month, the bar chart shows Books far ahead, and the pie gives Books 48.2 %.
Practical questions
Answers
i.
a = float(input("Enter first number: "))
b = float(input("Enter second number: "))
print("Sum =", a + b)
print("Difference =", a - b)
print("Product =", a * b)
print("Quotient =", a / b)
With 25 and 4: Sum = 29.0, Difference = 21.0, Product = 100.0,
Quotient = 6.25.
ii.
name = input("What is your name? ")
print("Hello,", name + "! Welcome to Python.")
With Bibek: Hello, Bibek! Welcome to Python.
iii. Program 4.4 without the even/odd lines.
iv.
a = int(input("Enter a: "))
b = int(input("Enter b: "))
a, b = b, a
print("After swapping: a =", a, "and b =", b)
With 12 and 45: After swapping: a = 45 and b = 12. (Without the tuple swap:
a = a + b, b = a - b, a = a - b.)
v.
sentence = input("Enter a sentence: ")
count = 0
for ch in sentence.lower():
    if ch in "aeiou":
        count = count + 1
print("Number of vowels:", count)
With "Computer Science is fun": Number of vowels: 8.
vi–viii.
with open("data.txt", "w") as f:
    f.write("Hello, this is a test file.\n")

with open("data.txt", "a") as f:
    f.write("This is an appended line.\n")

with open("data.txt", "r") as f:
    print(f.read(), end="")
The last part prints both lines: Hello, this is a test file. and
This is an appended line.
ix–x. Program 4.25. xi. print(pd.read_csv("result.csv").head()), as
in Program 4.27. xii. Program 4.26.
xiii. With sales.csv holding Product and Units columns:
import pandas as pd
import matplotlib.pyplot as plt

sales = pd.read_csv("sales.csv")
plt.pie(sales["Units"], labels=sales["Product"], autopct="%1.1f%%")
plt.title("Product sales")
plt.show()
xiv. Program 4.8. xv. Program 4.10. xvi. is_prime() in Program
4.13. xvii. largest() in the answer to Exercise 4.2, 3(d).
xviii.
filename = input("Enter file name: ")
try:
    with open(filename, "r") as f:
        print(f.read())
except FileNotFoundError:
    print("Sorry, the file", filename, "does not exist.")
For a missing file: Sorry, the file marks.txt does not exist.
Chapter summary
- Basics:
input()returns a string, so convert withint()/float(); types int, float, str, bool, list;/gives a float,//rounds down,%gives the remainder; selection with if, if-else, if-elif-else, nested if; loops withfor … in range(start, stop, step)andwhile. - Functions:
def name(parameters):…return value. Arguments may be positional, default (rate=10, placed last) or keyword (rate=8). A void function returns None;return a, breturns a tuple. Local variables live inside a function; global ones outside. - Modules, packages, libraries: import with
import m,from m import f,import m as alias.math(sqrt, pow, pi, ceil, floor, factorial, radians),random(random, randint inclusive, randrange, choice, shuffle, seed),datetime(date, timedelta, strftime); install packages withpip install. - Turtle: forward, backward, left, right, goto, penup, pendown, pensize, color, fillcolor with begin_fill/end_fill, circle, shape, speed; a regular n-gon turns 360°/n at each corner.
- Errors: syntax (caught before running), runtime exceptions
(ZeroDivisionError, ValueError, TypeError, NameError, IndexError,
FileNotFoundError) and logical errors.
try→except(on error) orelse(no error) →finally(always). - Files:
open(name, mode)with r, w (overwrite), a (append), x (new only); read, read(n), readline, readlines, write (no automatic newline), writelines, close, orwith. CSV with thecsvmodule or pandas. - pandas:
pd.read_csv,head,shape,columns,df["col"],df[df["col"] > n](combine with&,|and brackets),sort_values,mean,to_csv(index=False). - Matplotlib:
plt.plot(trend),plt.bar(compare),plt.piewithautopct(parts of a whole),plt.scatter(relationship); add title and axis labels;plt.show(). Seaborn makes statistical charts; Plotly makes interactive ones.
Practice questions
Group A — Multiple choice (1 mark each)
- What does
print(17 // 5, 17 % 5)display? [1]a3.4 2b3 2c3 3d2 3 - Which keyword is used to define a function? [1]afunctionbdefcdefinedfun
- A variable created inside a function has [1]aglobal scopeblocal scopecno typedmodule scope
- The value returned by
input()is always of type [1]aintbfloatcstrdbool - Which statement imports pandas with an alias? [1]aimport pandas as pdbimport pd as pandascfrom pandas alias pddalias pandas = pd
random.randint(1, 6)can return [1]a0 to 6b1 to 5c1 to 6d0 to 5- Which turtle method lifts the pen so that the turtle moves without drawing? [1]apendown()bpenup()chideturtle()dhome()
- To draw a regular hexagon, the turtle must turn at each corner by [1]a45°b60°c90°d120°
int("abc")raises [1]aTypeErrorbNameErrorcValueErrordZeroDivisionError- Which block runs whether or not an exception occurs? [1]atrybexceptcelsedfinally
- Which mode opens a file to add data at the end? [1]a"r"b"w"c"a"d"x"
- Which method saves a pandas DataFrame as a CSV file? [1]adf.save_csv()bdf.to_csv()cpd.write_csv()ddf.export()
- Which Matplotlib function draws a pie chart? [1]aplt.plot()bplt.bar()cplt.pie()dplt.circle()
Answers to Group A
1. (b) — 17 = 3 × 5 + 2.
2. (b) — def starts a function definition.
3. (b) — it exists only inside the function.
4. (c) — convert it with int() or float().
5. (a) — import module as alias.
6. (c) — randint includes both ends.
7. (b) — penup() lifts the pen.
8. (b) — 360° ÷ 6 = 60°.
9. (c) — the type is right (str) but the content is not a number.
10. (d) — finally always runs.
11. (c) — "a" appends; "w" would erase the file.
12. (b) — to_csv(), usually with index=False.
13. (c) — plt.pie() with labels and autopct.
Group B — Short answer (2 marks each)
- Write a function
rect_perimeter(l, b)that returns the perimeter of a rectangle, and call it for l = 12 and b = 8. [2] - Write a program that divides two numbers entered by the user and uses try-except to show a message when the divisor is zero. [2]
- Write the output of this program and show how you got it. [2]
total = 0
for i in range(1, 6, 2):
    total += i
print(total)
- Differentiate between a parameter and an argument with an example. [2]
- A file
log.txtcontains "Hi". What does it contain afteropen("log.txt", "w").write("Bye"), and what afteropen("log.txt", "a").write("Bye")instead? [2] - Write a turtle program to draw an equilateral triangle of side 100. [2]
- Write the output of this program. [2]
import pandas as pd
df = pd.DataFrame({"Name": ["Ram", "Sita", "Hari"], "Marks": [55, 82, 67]})
print(df[df["Marks"] > 60])
- Why is a line chart better than a pie chart for showing a student's marks in four terminal examinations? [2]
- Write the output of
import mathfollowed byprint(math.sqrt(49), math.ceil(4.1), math.floor(-4.1)). [2]
Answers to Group B
1.
def rect_perimeter(l, b):
    return 2 * (l + b)

print("Perimeter:", rect_perimeter(12, 8))
Output: Perimeter: 40.
2.
try:
    a = float(input("Enter dividend: "))
    b = float(input("Enter divisor: "))
    print("Quotient:", a / b)
except ZeroDivisionError:
    print("Error: the divisor cannot be zero.")
With 45 and 0 it prints Error: the divisor cannot be zero.; with 45 and 9,
Quotient: 5.0.
3. range(1, 6, 2) gives 1, 3, 5, so total = 1 + 3 + 5 = 9; output 9.
4. A parameter is the variable named in the function header; an argument is
the value given in the call. In def square(n): return n * n the parameter is
n; in square(6) the argument is 6.
5. With "w" the old text is erased: the file holds Bye. With "a" the new
text is added at the end: HiBye (no new line is added automatically).
6.
import turtle
t = turtle.Turtle()
for i in range(3):
    t.forward(100)
    t.left(120)
turtle.done()
7.
   Name  Marks
1  Sita     82
2  Hari     67
Only rows with marks above 60 are shown, with their original index numbers.
8. The four marks are values over time; a line chart joins them in order so the rise or fall in performance (the trend) is visible. A pie chart shows parts of a whole, and four marks are not parts of one total.
9. 7.0 5 -5 — the square root is a float, ceil rounds 4.1 up to 5 and
floor rounds −4.1 down to −5.
Group C — Long answer (4 marks each)
- Write a program with a user-defined function that takes a positive integer and returns the sum of its digits; the main program prints the sum and whether it is even or odd. [4]
- A file
sales.csvhas the columns Item, Quantity and Rate. Write a pandas program to(a) read the file,(b) add a column Amount = Quantity × Rate,(c) display the items whose amount is more than Rs 5,000, and(d) save them tobig_sales.csv. [4] - Write a program to draw a bar chart of the members of five school clubs — Science 24, Eco 18, Sports 35, Music 15, Coding 28 — with a title and axis labels, and state what the chart shows. [3+1]
- Write a turtle program with a function
polygon(t, sides, length)and use it to draw a square and a regular pentagon of side 80. Explain the turning angle. [3+1]
Answers to Group C
1.
def digit_sum(n):
    total = 0
    while n > 0:
        total += n % 10
        n //= 10
    return total

num = int(input("Enter a positive integer: "))
s = digit_sum(num)
print("Sum of digits:", s)
if s % 2 == 0:
    print("The sum is even.")
else:
    print("The sum is odd.")
Enter a positive integer: 4729
Sum of digits: 22
The sum is even.
2.
import pandas as pd

df = pd.read_csv("sales.csv")
df["Amount"] = df["Quantity"] * df["Rate"]
big = df[df["Amount"] > 5000]
print(big)
big.to_csv("big_sales.csv", index=False)
With five items in the file, the output was:
           Item  Quantity  Rate  Amount
0      Notebook       120    55    6600
2  Geometry box        25   250    6250
3           Bag         8  1400   11200
4    Calculator        10   950    9500
The pens (300 × 15 = 4,500) are left out, and the four rows above are saved in
big_sales.csv.
3.
import matplotlib.pyplot as plt

clubs = ["Science", "Eco", "Sports", "Music", "Coding"]
members = [24, 18, 35, 15, 28]

plt.bar(clubs, members, color="orange")
plt.title("Members in school clubs")
plt.xlabel("Club")
plt.ylabel("Number of members")
plt.show()
The chart shows one orange bar per club; Sports is clearly the most popular (35 members) and Music the least (15).
4.
import turtle

def polygon(t, sides, length):
    for i in range(sides):
        t.forward(length)
        t.left(360 / sides)

t = turtle.Turtle()
polygon(t, 4, 80)
t.penup()
t.goto(120, 0)
t.pendown()
polygon(t, 5, 80)
turtle.done()
To go once round a closed figure the turtle turns through 360° in total, so at each of the n corners it turns 360° ÷ n: 90° for the square and 72° for the pentagon. (Run under real turtle, the pentagon's corners came out at (120, 0), (200, 0), (224.7, 76.1), (160, 123.1) and (95.3, 76.1).)
Practise more: Computer Science question bank