Unit 9 · Zoology · 6 teaching hours · 26 min read
Human Population and Health Disorders
What the syllabus asks for 2
- Human Population
- Health disorders
This unit turns the biology of a single human body outwards onto whole populations. First it asks how many of us there are, how fast that number is changing, and what shape the population has — because the age structure of Nepal decides how many schools, jobs and hospital beds the country will need. Then it asks what makes people ill: microbes that pass from person to person, disorders that grow out of the way we live, and diseases caused simply by something missing from the plate.
Two things come almost every year. One is a definition-plus-calculation question on population: crude birth rate, death rate, growth rate, doubling time or dependency ratio, worked from given numbers. The other is a disease question — the life cycle of the malarial parasite, the structure of HIV and the course of AIDS, or a table comparing communicable and non-communicable diseases. Learn the malaria cycle as a drawing, not as a paragraph.
9.1 Human Population
Demography is the statistical study of human populations — their size, composition, distribution and the rates at which they change. It rests on three processes only: births add people, deaths remove them, and migration moves them between places.
9.1.1 The basic measures
Every demographic rate is a count divided by the population at risk, multiplied by a convenient factor (1000 or 100,000) so that the answer is a whole-ish number.
- Crude birth rate (CBR) — live births per 1000 people per year.
- Crude death rate (CDR) — deaths per 1000 people per year.
- Rate of natural increase (RNI) — CBR minus CDR, per 1000 per year.
- Total fertility rate (TFR) — the average number of children a woman would bear in her lifetime at current age-specific fertility rates.
- Infant mortality rate (IMR) — deaths of children under one year per 1000 live births (not per 1000 population).
where B is the number of live births in the year, D the number of deaths and P the mid-year population. Two more measures matter in Nepal:
- Maternal mortality ratio (MMR) — maternal deaths per 100,000 live births.
- Sex ratio — in Nepal this is reported as males per 100 females.
CBR and CDR ignore age structure. A country full of young adults can have a low CDR while being less healthy than a country full of pensioners. That is why Japan's CDR is higher than Nepal's even though Japanese people live much longer. Compare age-specific rates or life expectancy instead.
Problem. A municipality had a mid-year population of 250,000. During that year 4500 live births and 1300 deaths were registered, and 90 of the deaths were of infants under one year old. Find (a) the CBR, (b) the CDR, (c) the rate of natural increase as a percentage, (d) the IMR, and (e) the time the population would take to double from natural increase alone.
Solution.
(a) \text{CBR} = \dfrac{4500}{250000}\times 1000 = 18.0 per 1000 per year.
(b) \text{CDR} = \dfrac{1300}{250000}\times 1000 = 5.2 per 1000 per year.
(c) \text{RNI} = 18.0 - 5.2 = 12.8 per 1000, and since "per 1000" divided by 10 gives "per cent",
(d) The IMR uses live births, not population, as the denominator:
(e) By the rule of 70, T_d \approx 70/1.28 = 54.7 \approx 55 years.
9.1.2 How populations grow
If a population grows by a fixed number each year the growth is arithmetic and the graph is a straight line. Real populations grow by a fixed proportion each year, so the increase itself gets bigger every year. This is exponential (geometric) growth, and its graph is the familiar J-shaped curve:
Here P_0 is the population at the start, P_t the population after time t years, and r the annual growth rate expressed as a decimal fraction.
The population has doubled when P_t = 2P_0. Substituting into P_t = P_0e^{rt} and cancelling P_0,
If the rate is quoted as a percentage, r = R/100, so
This is the rule of 70: divide 70 by the percentage growth rate to get the doubling time in years.
Nepal has been counted every ten years since 1911, so its growth curve is one of the best-documented in South Asia.
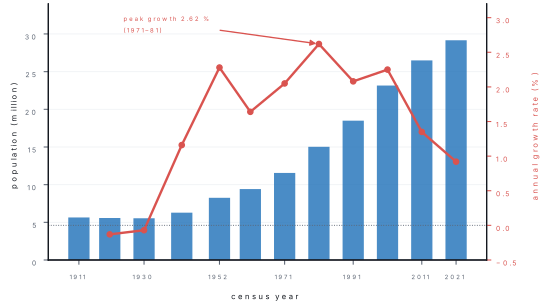
Problem. The 2011 census (reference date 22 June 2011) counted 26,494,504 people and the 2021 census (reference date 25 November 2021) counted 29,164,578. The interval between the two reference dates is 10.43 years. Calculate (a) the annual exponential growth rate and (b) the doubling time at that rate.
Solution.
(a) \dfrac{P_t}{P_0} = \dfrac{29\,164\,578}{26\,494\,504} = 1.1008, so
That is r = 0.92\ \% per year — exactly the figure the National Statistics Office published for the 2021 census.
(b) T_d = \dfrac{0.693}{0.00921} = 75.2 years. (The rule of 70 gives 70/0.92 = 76 years, close enough for a quick check.)
Notice what would happen if you carelessly used t = 10 years instead of 10.43: you would get 0.96 %, and your answer would not match the official figure. The census was delayed five months by COVID-19, and the extra months matter.
9.1.3 Age–sex structure and the population pyramid
A population pyramid (age–sex pyramid) is a pair of back-to-back horizontal bar graphs: age groups stacked from youngest at the bottom to oldest at the top, males to the left of the axis and females to the right. Its shape is a fingerprint of a country's birth rate, death rate and migration history.
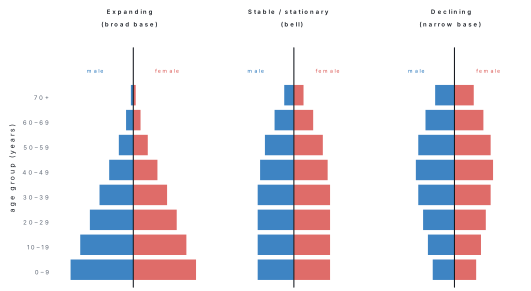
| Pyramid shape | Birth rate | Death rate | Growth | Example |
|---|---|---|---|---|
| Expanding — broad base, narrow top | high | high | rapid | Niger, Afghanistan |
| Stable — nearly vertical sides | moderate | low | slow | Nepal today, India |
| Declining — narrow base, wide middle | low | low | negative | Japan, Italy |
Nepal's own age structure has changed visibly in one decade. The base of the pyramid is now narrower than the band above it — the 0–9 group (5.21 million) is smaller than the 10–19 group (5.88 million). That is the arithmetic signature of falling fertility.
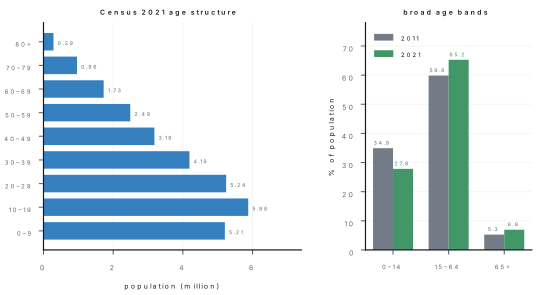
The dependency ratio turns the age structure into a single number: how many people who are not of working age each 100 workers must support.
Problem. The 2021 census counted 8,115,575 people aged 0–14, 19,027,289 aged 15–64 and 2,021,714 aged 65 and over. Calculate the child, old-age and total dependency ratios, and comment.
Solution. Number of dependants = 8\,115\,575 + 2\,021\,714 = 10\,137\,289.
So every 100 Nepalis of working age support about 53 dependants, of whom 43 are children and 11 are elderly. Since dependency is low and falling, Nepal is inside its demographic dividend — a few decades in which the working-age share is unusually large. The dividend only pays if those workers find jobs.
9.1.4 The demographic transition
The demographic transition model (DTM) describes the path every industrialising society has followed from high birth and death rates to low ones. It has four recognised stages (a fifth, of population decline, is sometimes added).
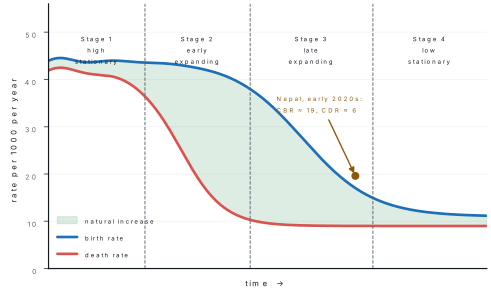
| Stage | Birth rate | Death rate | Natural increase | Why |
|---|---|---|---|---|
| 1 High stationary | high (~40) | high (~40) | near zero | famine, epidemics, no medicine |
| 2 Early expanding | high | falls steeply | very rapid | clean water, vaccines, better food |
| 3 Late expanding | falls | low | slows down | contraception, girls' education, urban life |
| 4 Low stationary | low (~12) | low (~10) | near zero | small planned families |
Nepal moved through Stage 2 between about 1950 and 1990 — malaria control in the Terai, smallpox eradication and expanded immunisation cut deaths while births stayed high, which is why growth peaked at 2.62 % in the 1970s. Since 1990 the birth rate has fallen sharply: the total fertility rate was 4.6 children per woman in 1996 and 2.1 in 2022 (Nepal Demographic and Health Survey 2022) — essentially replacement level.
9.1.5 Nepal's population situation
| Indicator | Value | Year and source |
|---|---|---|
| Total population | 29,164,578 | Census 2021 (NSO) |
| Male : female | 14,253,551 : 14,911,027 | Census 2021 |
| Sex ratio | 95.59 males per 100 females | Census 2021 |
| Annual growth rate | 0.92 % | Census 2011–2021 |
| Population density | 198 per km² | Census 2021 |
| Households / mean size | 6,666,937 / 4.37 persons | Census 2021 |
| Urban (municipality) share | 66.17 % | Census 2021 |
| Absent population abroad | 2,190,592 (82.2 % male) | Census 2021 |
| Literacy (age 5+) | 76.2 % (M 83.6, F 69.4) | Census 2021 |
| Life expectancy at birth | 71.3 yr (M 68.2, F 73.8) | Census 2021 (NSO) |
| Total fertility rate | 2.1 children per woman | NDHS 2022 |
| Infant mortality rate | 28 per 1000 live births | NDHS 2022 |
| Neonatal mortality rate | 21 per 1000 live births | NDHS 2022 |
| Under-five mortality rate | 33 per 1000 live births | NDHS 2022 |
| Maternal mortality ratio | 151 per 100,000 live births | NMMS 2021 |
| Projected population | 30,034,040 (1 July 2026) | NSO projection |
Four features of this table deserve comment.
- There are more women than men. Nepal is one of few countries with a sex ratio below 100, and the reason is on the next line of the table: over 2.1 million Nepalis, four-fifths of them men, were abroad on census day.
- Growth has almost stopped. Falling fertility plus emigration gave the slowest growth in 110 years of census-taking.
- Nepal has become an urban country on paper. The 66 % urban share follows the 2015–17 redrawing of local units, which converted many rural areas into municipalities; much of that "urban" land is still farmland.
- Mortality has fallen fast. Maternal deaths fell from 539 per 100,000 live births in 1996 to 151 in 2021 — one of the fastest declines recorded anywhere.
Rapid growth strains land, forest, water, housing and schools, drives encroachment on the Chure hills, and makes unemployment and out-migration worse. Nepal's response has combined family planning services, female education, raising the legal age of marriage to 20, immunisation and safe-motherhood programmes that make parents confident their children will survive, and social security for the elderly. Education is the single most effective measure: fertility falls fastest where girls stay longest in school.
9.2 Health disorders
Health is a state of complete physical, mental and social well-being, and not merely the absence of disease or infirmity.
A disease is any disturbance of the normal structure or working of the body that produces recognisable signs and symptoms. Diseases are grouped as follows.
- Communicable (infectious) — caused by a pathogen and transmissible from one host to another: bacterial, viral, protozoan, helminthic, fungal.
- Non-communicable (NCD) — not transmissible: degenerative, metabolic, neoplastic (cancer), allergic and genetic disorders.
- Deficiency diseases — caused by lack of a nutrient.
9.2.1 Communicable diseases
| Disease | Pathogen | Transmission | Main symptoms | Prevention |
|---|---|---|---|---|
| Tuberculosis | Mycobacterium tuberculosis (bacterium) | airborne droplets | chronic cough >2 weeks, blood in sputum, evening fever, weight loss | BCG vaccine, DOTS treatment, ventilation |
| Typhoid | Salmonella typhi (bacterium) | faecal contamination of food and water | step-ladder fever, rose spots, abdominal pain | safe water, TCV vaccine, hygiene |
| Cholera | Vibrio cholerae (bacterium) | contaminated water | painless rice-water stools, rapid dehydration | chlorination, ORS, oral vaccine |
| Tetanus | Clostridium tetani (bacterium) | spores entering deep wounds | lock-jaw, muscle spasm, opisthotonus | TT/DPT vaccine, wound cleaning |
| Pneumonia | Streptococcus pneumoniae and others | droplets | fast breathing, chest indrawing, fever | PCV vaccine, avoid indoor smoke |
| Influenza | Influenza A/B virus | droplets | fever, body ache, sore throat | annual vaccine, cough etiquette |
| Hepatitis B | Hepatitis B virus | blood, sexual contact, mother to child | jaundice, dark urine, liver damage | HBV vaccine, screened blood |
| Rabies | Rabies virus (Lyssavirus) | bite or lick of an infected dog, bat, jackal | hydrophobia, excitement, paralysis, death | dog vaccination, post-exposure vaccine |
| Dengue | Dengue virus (4 serotypes) | bite of Aedes aegypti / Ae. albopictus | high fever, retro-orbital pain, rash, joint pain | destroy clean-water breeding sites |
| AIDS | Human immunodeficiency virus | unsafe sex, infected blood/needles, mother to child | opportunistic infections, wasting | safe sex, screened blood, ART |
| Malaria | Plasmodium spp. (protozoan) | bite of female Anopheles | cold–hot–sweating fever paroxysms, anaemia, enlarged spleen | bed nets, spraying, prompt treatment |
| Amoebic dysentery | Entamoeba histolytica (protozoan) | cysts in food and water | stool with blood and mucus, cramps | safe water, hand washing |
| Kala-azar | Leishmania donovani (protozoan) | bite of Phlebotomus argentipes sandfly | long fever, darkened skin, huge spleen | indoor spraying, plastered walls |
| Ascariasis | Ascaris lumbricoides (roundworm) | eggs in soil-contaminated food | abdominal pain, malnutrition, worms in stool | latrine use, deworming, washing vegetables |
| Taeniasis | Taenia solium (tapeworm) | undercooked pork with cysticerci | abdominal discomfort, segments in stool | meat inspection, thorough cooking |
| Ringworm | Trichophyton, Microsporum (fungi) | contact, shared towels and combs | itchy ring-shaped scaly patches | keep skin dry, do not share clothing |
How the marker reads a disease answer
Four marks usually means four facts: pathogen, mode of transmission, two or three symptoms, and one control measure. Write the pathogen's scientific name in italics with a capital for the genus and lower case for the species — Plasmodium vivax, not plasmodium Vivax. Markers do deduct for this.
9.2.2 Malaria — the parasite and its two hosts
Malaria is caused by four species of Plasmodium: P. vivax (benign tertian malaria, fever every 48 h), P. falciparum (malignant tertian, 48 h, the species that kills), P. malariae (quartan, 72 h) and P. ovale. In Nepal P. vivax is by far the commonest. The vector is the female Anopheles mosquito; the recognised vectors in Nepal are Anopheles fluviatilis, An. annularis, An. maculatus and An. minimus.
Humans are the intermediate host, because only the asexual phase (schizogony) occurs in us. The mosquito is the definitive host, because fertilisation and the sexual phase (gamogony and sporogony) occur in it. Students reverse this constantly — the definitive host is defined by sex, not by size or by who suffers.
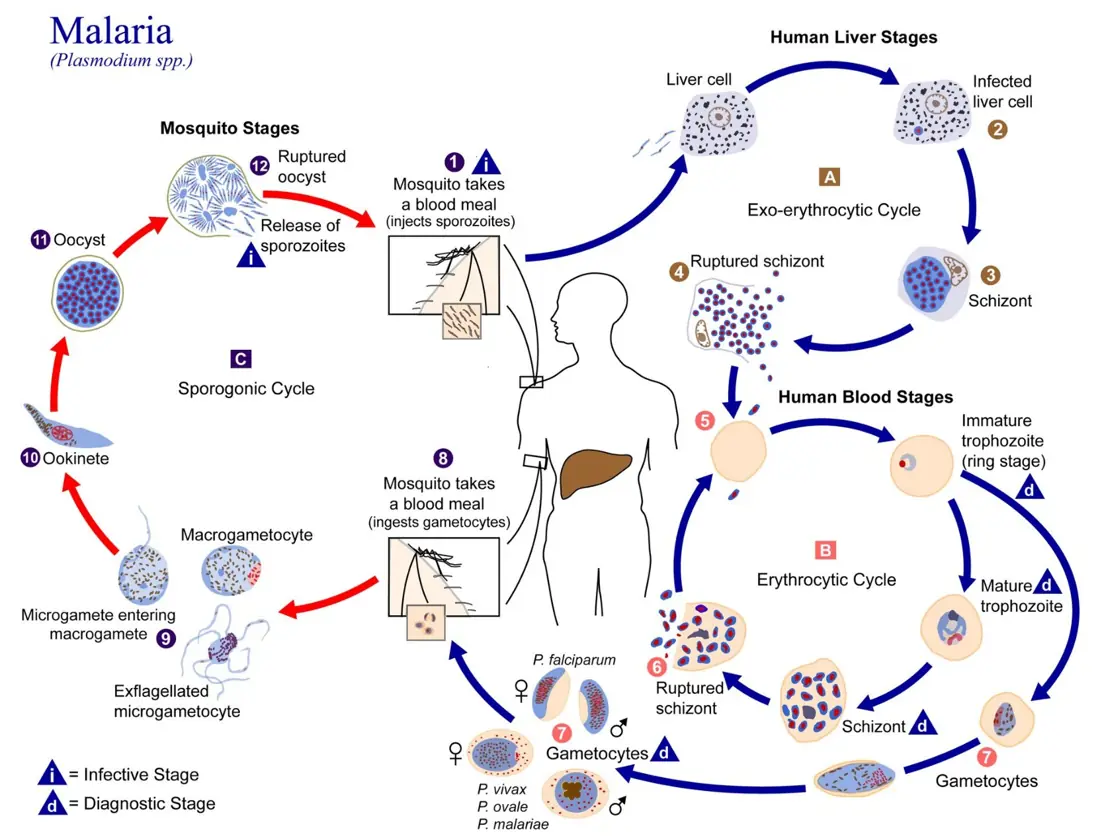
The fever comes from the bursting of red cells. In P. vivax the erythrocytic cycle takes 48 hours, so paroxysms recur every third day (counting inclusively) — hence "tertian". Each paroxysm has three phases: a cold stage with shivering, a hot stage with high fever, and a sweating stage as the temperature falls.
Malaria has been pushed to the edge of elimination. The Epidemiology and Disease Control Division recorded 37 indigenous cases and 1006 imported cases in 2024, and WHO's World Malaria Report 2025 records 2 deaths for that year. Almost all remaining transmission is in the Terai; most imported cases are in migrant workers returning from India and Africa. Nepal's elimination target has been moved from 2026 to 2030.
9.2.3 AIDS and HIV
AIDS — acquired immunodeficiency syndrome — is the late stage of infection with HIV, a retrovirus of the family Retroviridae. HIV is a spherical enveloped virus about 100–120 nm across, with two identical strands of single-stranded RNA and three enzymes of its own.
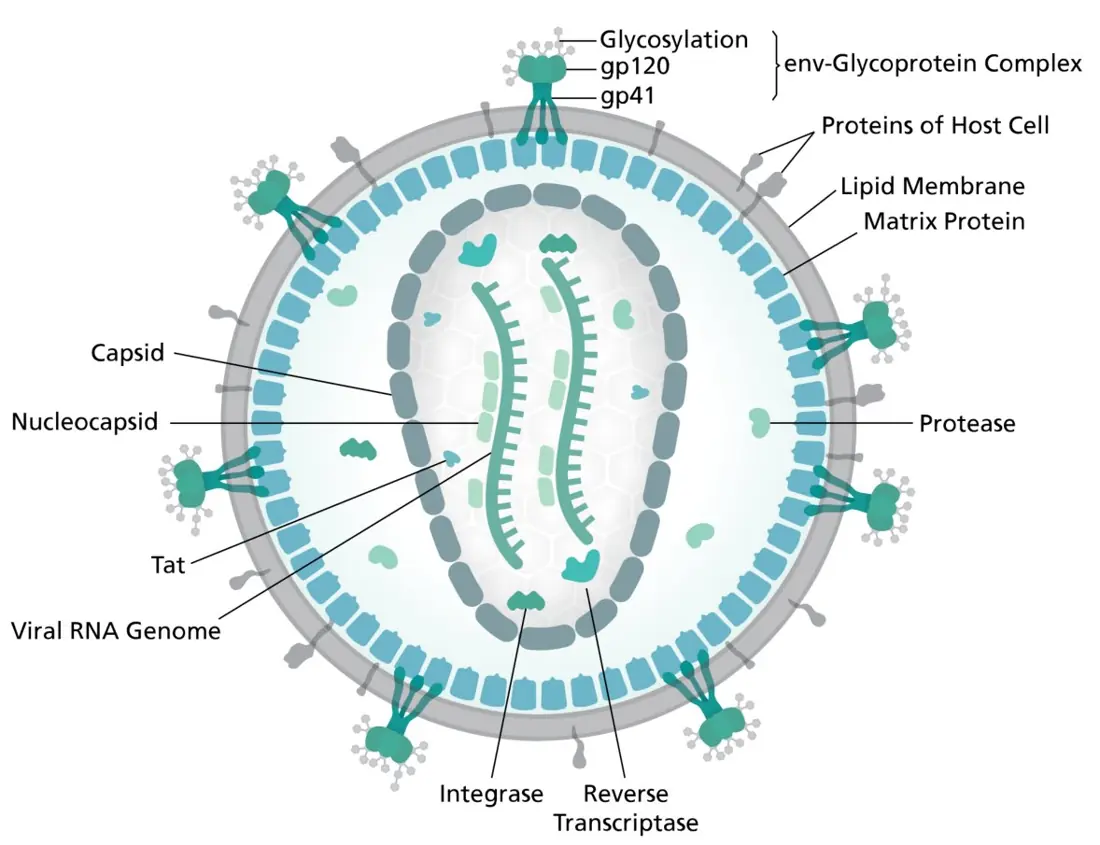
The target of HIV is the helper T lymphocyte (CD4⁺ T cell), the cell that coordinates the whole immune response. Reverse transcriptase copies viral RNA into DNA, integrase splices that DNA into the host chromosome as a provirus, and the infected cell then manufactures new virions until it is destroyed.
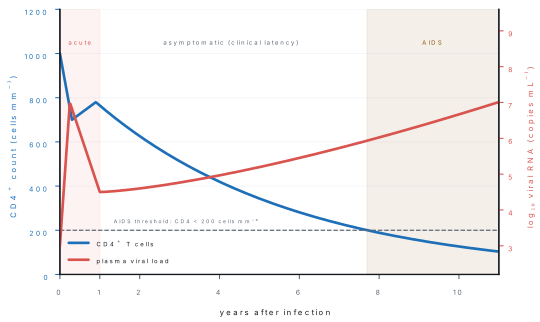
HIV spreads by unprotected sexual contact, transfusion of infected blood or sharing of needles, and from mother to child across the placenta, during birth or in breast milk. It does not spread by touching, sharing food, mosquito bites, coughing or using the same toilet. There is no cure, but antiretroviral therapy (ART) holds the virus down for decades.
The National Centre for AIDS and STD Control estimated 34,337 people living with HIV in Nepal in 2024, with 614 new infections and 559 AIDS-related deaths in that year, and about 77 % of those diagnosed on ART. New infections have fallen by roughly three-quarters since 2010 (2557 new infections that year). About two-thirds of transmission is heterosexual, and the largest risk group is male labour migrants and their partners.
9.2.4 Immunity and the immune response
Immunity is the ability of the body to resist a pathogen.
| Basis | Type | Example |
|---|---|---|
| Present from birth, non-specific | innate (natural) immunity | skin, mucus, lysozyme in tears, stomach acid, phagocytes, inflammation |
| Developed after exposure, specific | acquired (adaptive) immunity | antibodies after chickenpox |
| Body makes its own antibodies | active — natural (after infection) or artificial (vaccine) | BCG, DPT, measles–rubella |
| Ready-made antibodies given | passive — natural (placenta, colostrum) or artificial (antiserum) | anti-tetanus serum, anti-rabies serum |
An antigen is any foreign molecule that provokes a response; an antibody (immunoglobulin) is a Y-shaped protein made by plasma cells that binds one antigen specifically. The five classes are IgG (most abundant, the only one crossing the placenta), IgM (first made, largest), IgA (in mucus, saliva and colostrum), IgE (allergy) and IgD (receptor on B cells).
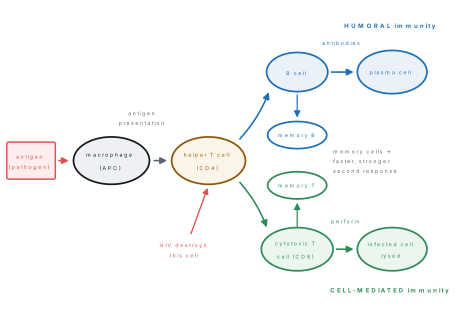
Because the helper T cell sits at the centre of the diagram, destroying it — as HIV does — disables both limbs at once. That is why AIDS patients die of ordinary organisms: tuberculosis, Pneumocystis pneumonia, candidiasis, Kaposi's sarcoma.
A vaccine is a preparation of killed, weakened (attenuated), toxoid or subunit antigen that produces active artificial immunity together with memory cells, without causing the disease.
9.2.5 Non-communicable diseases
| Disease | Nature | Main causes / risk factors | Prevention |
|---|---|---|---|
| Hypertension | persistent BP ≥ 140/90 mm Hg | salt, obesity, alcohol, stress, heredity | less salt, exercise, weight control |
| Coronary heart disease | narrowing of coronary arteries by atheroma | smoking, high LDL, diabetes, inactivity | no tobacco, diet, exercise |
| Stroke | brain artery blocked or ruptured | hypertension, smoking, atrial fibrillation | blood-pressure control |
| COPD | irreversible airway obstruction | tobacco smoke, biomass and indoor smoke, dust | clean cooking fuel, no smoking |
| Asthma | reversible bronchospasm | allergens, cold air, exercise, pollution | avoid triggers, inhalers |
| Diabetes mellitus | type 1 — no insulin; type 2 — insulin resistance | heredity, obesity, inactivity, sugar-rich diet | weight control, exercise |
| Cancer | uncontrolled cell division, metastasis | tobacco, chewing tobacco, HPV, radiation, aflatoxin | screening, vaccination, no tobacco |
| Goitre | enlarged thyroid | dietary iodine deficiency | iodised salt |
| Arthritis | joint inflammation / cartilage wear | age, autoimmunity, obesity | weight control, physiotherapy |
| Allergy | hypersensitivity, IgE-mediated | pollen, dust mite, foods, drugs | avoid allergen, antihistamines |
Nepal is going through an epidemiological transition: infections are retreating and NCDs are taking over. WHO has put the NCD share of all deaths in Nepal at about 66 %, and GBD-based estimates for 2019 at about 71 %. The Global Burden of Disease 2023 analysis ranks chronic obstructive pulmonary disease, ischaemic heart disease and stroke as the three leading causes of death, with air pollution the leading risk factor. Nepal's NCD STEPS Survey 2019 (adults 15–69) found raised blood pressure in 24.5 %, raised blood glucose in 5.8 %, raised total cholesterol in 11 %, overweight or obesity in 24.3 %, and tobacco use in 28.9 % (48.3 % of men, 11.6 % of women). GLOBOCAN 2022 recorded 22,008 new cancer cases and 14,704 cancer deaths in Nepal.
9.2.6 Deficiency diseases
| Missing nutrient | Disease | Chief signs |
|---|---|---|
| Protein + energy | kwashiorkor | oedema of feet, moon face, flaky skin, enlarged liver |
| Energy (severe) | marasmus | extreme wasting, "old man" face, no subcutaneous fat |
| Vitamin A | night blindness → xerophthalmia | poor vision in dim light, Bitot's spots, corneal ulcer |
| Vitamin B₁ (thiamine) | beriberi | leg oedema (wet) or nerve damage and weakness (dry) |
| Vitamin B₂ (riboflavin) | cheilosis | cracks at corners of the mouth, sore red tongue |
| Vitamin B₃ (niacin) | pellagra | the three D's — dermatitis, diarrhoea, dementia |
| Vitamin B₁₂ / folate | megaloblastic anaemia | large immature red cells, weakness, sore tongue |
| Vitamin C | scurvy | bleeding spongy gums, loose teeth, slow wound healing |
| Vitamin D | rickets (child), osteomalacia (adult) | bow legs, pigeon chest, soft painful bones |
| Vitamin K | bleeding tendency | prolonged clotting time |
| Iron | iron-deficiency anaemia | pallor, tiredness, breathlessness, spoon nails |
| Iodine | goitre; cretinism in infants | neck swelling; stunted growth and mental retardation |
| Calcium | tetany, osteoporosis | muscle cramps, brittle bones |
- Pellagra = Dermatitis, Diarrhoea, Dementia (vitamin B₃).
- Kwashiorkor swells (oedema); marasmus shrinks (wasting).
- Rickets bends growing bone; osteomalacia softens grown bone.
Nepal's own figures show real progress with real gaps. The Nepal Demographic and Health Survey 2022 found 25 % of children under five stunted (down from 57 % in 1996), 8 % wasted and 19 % underweight, while 43 % of children aged 6–59 months and 34 % of women aged 15–49 were anaemic. Universal salt iodisation has made endemic goitre in the hills, once very common, rare.
Chapter summary
- \text{CBR} = (B/P)\times 1000; \text{CDR} = (D/P)\times 1000; \text{RNI} = \text{CBR}-\text{CDR}; IMR uses live births as denominator.
- Exponential growth: P_t = P_0e^{rt}, so r = \frac{1}{t}\ln(P_t/P_0) and doubling time T_d = 0.693/r \approx 70/R\%.
- Dependency ratio = \dfrac{P_{0-14}+P_{65+}}{P_{15-64}}\times 100; for Nepal in 2021 it is 53.3 (child 42.7, old-age 10.6).
- Census 2021: 29,164,578 people, growth 0.92 % per year, sex ratio 95.59, density 198 km⁻², 66.17 % urban, 2.19 million absent abroad, life expectancy 71.3 years. NDHS 2022: TFR 2.1, IMR 28, U5MR 33. NMMS 2021: MMR 151.
- Population pyramids are expanding (broad base), stable or declining (narrow base); Nepal's base is now narrower than the band above it.
- The demographic transition runs from Stage 1 (high birth, high death) through Stage 2 (death falls, growth fastest) and Stage 3 (birth falls) to Stage 4 (both low). Nepal is in late Stage 3.
- Malaria: human = intermediate host (schizogony in liver and RBC); female Anopheles = definitive host (gamogony and sporogony); infection by sporozoites in saliva.
- HIV is a retrovirus that destroys CD4⁺ helper T cells; AIDS is diagnosed when the CD4⁺ count falls below 200 cells mm⁻³.
- Immunity is innate or acquired; acquired immunity is active (infection or vaccine) or passive (placenta, colostrum, antiserum), and has a humoral (antibody) and a cell-mediated limb.
Practice questions
Group A — Multiple choice (1 mark each)
- The definitive host of the malarial parasite is [1]amanbfemale Anophelescmale AnophelesdCulex
- Crude death rate is expressed as deaths per [1]a100 populationb1000 populationc1000 live birthsd100,000 live births
- AIDS is diagnosed when the CD4⁺ T-cell count falls below [1]a1000 mm⁻³b800 mm⁻³c500 mm⁻³d200 mm⁻³
- A population pyramid with a broad base and a narrow apex indicates [1]aa declining populationba stationary populationca rapidly growing populationdzero growth
- Which immunoglobulin crosses the placenta? [1]aIgAbIgMcIgGdIgE
- The annual population growth rate reported by Nepal's 2021 census was [1]a0.92 %b1.35 %c2.25 %d2.62 %
Answers to Group A
1. (b) — fertilisation and sporogony occur in the female Anopheles.
2. (b) — CDR is per 1000 mid-year population; (c) and (d) are IMR and MMR.
3. (d) — below 200 cells mm⁻³ the patient is defined as having AIDS.
4. (c) — many children and few old people means high birth rate and fast growth.
5. (c) — IgG is the only class small enough to cross the placenta, giving the newborn passive natural immunity.
6. (a) — 0.92 %, the lowest positive rate since censuses began in 1911.
Group B — Short answer (4 marks each)
- Define crude birth rate, crude death rate and rate of natural increase. A district of 480,000 people registered 8160 live births and 3360 deaths in one year; find all three rates. [4]
- What is a population pyramid? Draw and label the pyramid of a rapidly growing population and state two features that identify it. [4]
- Explain the four stages of the demographic transition model and state, with a reason, which stage Nepal is in. [4]
- Differentiate between communicable and non-communicable diseases, giving two examples of each. [4]
- The 2021 census counted 29,164,578 people in Nepal's area of 147,516 km². Calculate the population density, and the population expected in 2031 if growth continues at 0.92 % per year. [4]
- Write short notes on active and passive immunity, with one example of each. [4]
Answers to Group B
1. Definitions as in §9.1.1. \text{CBR} = \frac{8160}{480000}\times 1000 = 17.0 per 1000; \text{CDR} = \frac{3360}{480000}\times 1000 = 7.0 per 1000; \text{RNI} = 17.0 - 7.0 = 10.0 per 1000, i.e. 1.0 % per year (doubling time \approx 70 years).
3. Outline: Stage 1 both rates high, growth near zero; Stage 2 death rate falls (clean water, vaccines) while birth rate stays high, growth fastest; Stage 3 birth rate falls (contraception, female education), growth slows; Stage 4 both rates low, growth near zero. Nepal is in late Stage 3 — CDR is already low (about 6 per 1000) and the birth rate has fallen to about 19 per 1000 with TFR 2.1, so natural increase is small but still positive.
5. Density = \dfrac{29\,164\,578}{147\,516} = 197.7 \approx 198 persons km⁻².
About 32.0 million — an increase of roughly 2.8 million in ten years.
Group C — Long answer (8 marks each)
- (a) Describe the life cycle of Plasmodium vivax in man and in the mosquito with a labelled diagram. [6](b) Name the vector, state why the mosquito is called the definitive host, and give two control measures used in Nepal. [2]
- (a) Draw a labelled diagram of the HIV virion and describe how HIV infects a helper T cell. [4](b) List the modes of transmission of HIV, describe the three clinical phases of untreated infection, and state four preventive measures. [4]
- The 2011 census recorded 26,494,504 people and the 2021 census 29,164,578, an interval of 10.43 years. The 2021 age distribution was 0–14: 8,115,575; 15–64: 19,027,289; 65+: 2,021,714.(a) Calculate the annual growth rate and the doubling time. [4](b) Calculate the total, child and old-age dependency ratios and explain what they tell a planner about Nepal's future. [4]
Answer outline to Group C question 3
(a) P_t/P_0 = 1.1008, \ln 1.1008 = 0.0960, so r = 0.0960/10.43 = 0.00921 = 0.92\ \% per year, and T_d = 0.693/0.00921 = 75.2 years.
(b) Total dependency = \frac{10\,137\,289}{19\,027\,289}\times 100 = 53.3; child = 42.7; old-age = 10.6. Interpretation: two-thirds of Nepalis are of working age, so the country is inside its demographic dividend and needs jobs and skills above all. But old-age dependency is rising (65+ rose from 5.27 % of the population in 2011 to 6.93 % in 2021), so pensions, geriatric care and NCD services must be built now, before the dividend closes.
Practise more: Biology question bank