Unit 10 · 20 min read
Statistics
What the syllabus asks for 4
- Arithmetic mean of ungrouped and grouped data
- Median and quartiles of ungrouped data
- Mode of ungrouped and grouped data
- Range and coefficient of range
A ward office in Banepa wants to know the typical size of a family. A teacher wants one number that sums up how a class did in a test. A weather station in Jumla wants to say how much the temperature changed during a week. Statistics answers such questions by condensing a long list of numbers into a few meaningful ones. A measure of central tendency (an average) tells us where the middle of the data lies: the mean, the median and the mode are three different answers, each with its own use. Quartiles split ordered data into four equal parts, and the range with its coefficient tells us how widely the data are spread. In this chapter you will compute each of these for ungrouped data and, where the syllabus asks, for grouped data in class intervals.
Expect: (i) the mean of individual data, of a frequency table, and of grouped data using mid-values; (ii) a missing value or a missing frequency when the mean is given; (iii) the median and the quartiles Q_1 and Q_3 of individual and discrete data, including interpolation when the position is not a whole number; (iv) the mode of individual and discrete data, and of grouped data with the formula M_o=L+\frac{f_1-f_0}{2f_1-f_0-f_2}\times i; (v) the range and coefficient of range, and comparing two sets of data. Show the table: the columns earn the method marks.
Three kinds of data
| Kind | What it looks like | Example |
|---|---|---|
| Individual series (raw data) | each value listed separately | marks of 8 students: 32, 41, 28, … |
| Discrete series (ungrouped frequency table) | each exact value with its frequency | family size 2, 3, 4, … with the number of families |
| Continuous series (grouped data) | values grouped into class intervals with frequencies | marks 0–10, 10–20, … with the number of students |
In a class interval such as 10–20, 10 is the lower limit and 20 the upper limit; the class width is i=20-10=10 and the mid-value is m=\frac{10+20}{2}=15. A mark of exactly 20 is counted in the class 20–30, not in 10–20.
10.1 Arithmetic mean of ungrouped and grouped data
The arithmetic mean (or simply the mean) is what most people call "the average": the total shared out equally.
For individual data x_1, x_2, \ldots, x_n, and for frequency tables:
where N=\sum f is the total frequency and m is the mid-value of each class.
In the continuous case we do not know the exact values inside a class, so we assume that every value in a class sits at its middle. The answer is therefore a good estimate rather than the exact mean.
Problem. The marks (out of 50) of 8 students in an Optional Mathematics test are 32, 41, 28, 45, 37, 30, 44 and 39. Find the mean mark.
Solution. \sum x=32+41+28+45+37+30+44+39=296 and n=8, so
Two properties of the mean
The deviations from the mean add up to zero. For the eight marks above, the differences from the mean 37 are
and their sum is 0. The values above the mean exactly balance the values below it. This is why the mean is called the balance point of the data, and it gives a quick check of any mean you have calculated.
Adding a constant shifts the mean by the same constant. If the teacher adds 5 bonus marks to every student, every value goes up by 5, the total goes up by 8\times5=40, and the mean becomes 37+5=42. In the same way, multiplying every value by a number multiplies the mean by that number.
Problem. The mean of 5, 8, x, 12 and 15 is 10. Find x.
Solution. Mean \times number of values = total, so the five values add to 10\times5=50. Then 5+8+x+12+15=50, so 40+x=50 and x=10.
Problem. The number of mobile phones in 30 households of a ward is given below. Find the mean number of phones per household.
| Phones x | 1 | 2 | 3 | 4 | 5 |
|---|---|---|---|---|---|
| Households f | 2 | 6 | 10 | 8 | 4 |
Solution. Multiply each value by its frequency and add.
| x | f | fx |
|---|---|---|
| 1 | 2 | 2 |
| 2 | 6 | 12 |
| 3 | 10 | 30 |
| 4 | 8 | 32 |
| 5 | 4 | 20 |
| Total | N=30 | \sum fx=96 |
Problem. The mean of the following distribution is 24. Find p.
| x | 10 | 20 | 30 | 40 |
|---|---|---|---|---|
| f | 3 | p | 5 | 2 |
Solution. N=10+p and \sum fx=30+20p+150+80=260+20p. Using \overline{X}=\frac{\sum fx}{N}:
Check: N=15, \sum fx=360 and \frac{360}{15}=24 ✓.
Problem. The marks of 40 students are grouped below. Find the mean mark.
| Marks | 0–10 | 10–20 | 20–30 | 30–40 | 40–50 |
|---|---|---|---|---|---|
| Students | 4 | 6 | 12 | 10 | 8 |
Solution. Use the mid-value of each class.
| Marks | f | Mid-value m | fm |
|---|---|---|---|
| 0–10 | 4 | 5 | 20 |
| 10–20 | 6 | 15 | 90 |
| 20–30 | 12 | 25 | 300 |
| 30–40 | 10 | 35 | 350 |
| 40–50 | 8 | 45 | 360 |
| Total | N=40 | \sum fm=1120 |
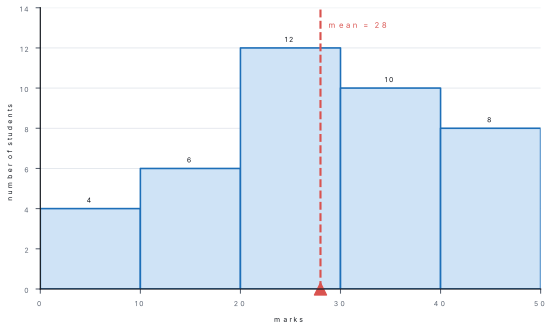
In a frequency table the mean is \frac{\sum fx}{N}, where N=\sum f is the number of observations. Dividing by the number of rows (5 in the last example) instead of by 40 is a very common mistake. Another is to multiply the frequencies by the class limits instead of the mid-values.
10.2 Median and quartiles of ungrouped data
Median
The median is the middle value when the data are arranged in order. Half the observations are below it and half above it. Unlike the mean, it is not pulled about by a few very large or very small values.
Arrange the data in ascending order. For n observations,
If n is odd this is the single middle item. If n is even, \frac{n+1}{2} is a half-number and the median is the mean of the two middle items.
Quartiles
Just as the median cuts the ordered data into two halves, the three quartiles cut it into four quarters.
With the data in ascending order:
Q_1 is the first (lower) quartile: one quarter of the data lie below it. Q_2 is the median. Q_3 is the third (upper) quartile: three quarters lie below it.
Why \frac{n+1}{2} and not \frac{n}{2}? With 9 values in order, the positions are 1 to 9 and the middle one is the 5th: four values on each side. The middle of the positions 1 and n is their average, \frac{1+n}{2}. With 10 values, \frac{11}{2}=5.5 points halfway between the 5th and the 6th values, which is exactly where the middle lies. The quartile positions follow the same pattern, one quarter and three quarters of the way along.
If the position is not a whole number, interpolate between the two neighbouring items. For example the 2.5th item is the 2nd item plus 0.5\times(3rd item - 2nd item), and the 2.75th item is the 2nd item plus 0.75\times(3rd - 2nd).
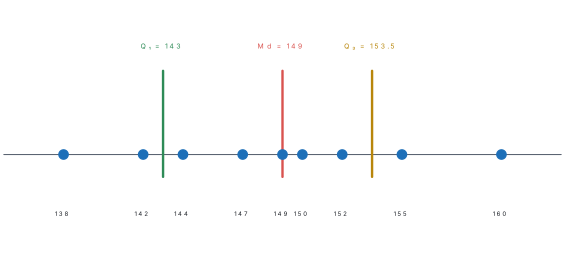
Problem. The heights (in cm) of 9 students are 142, 150, 138, 155, 147, 160, 144, 152 and 149. Find the median and the quartiles.
Solution. In ascending order:
Median: \frac{9+1}{2}=5th item, so M_d=149 cm.
Q_1: \frac{9+1}{4}=2.5th item =142+0.5(144-142)=143 cm.
Q_3: \frac{3(9+1)}{4}=7.5th item =152+0.5(155-152)=153.5 cm.
Problem. The rainfall (in mm) recorded on 10 days of Shrawan was 25, 18, 30, 22, 27, 35, 20, 28, 24 and 32. Find the median and the quartiles.
Solution. In order: 18, 20, 22, 24, 25, 27, 28, 30, 32, 35 (n=10).
Median: \frac{11}{2}=5.5th item, halfway between the 5th and 6th: M_d=\frac{25+27}{2}=26 mm.
Q_1: \frac{11}{4}=2.75th item =20+0.75(22-20)=21.5 mm.
Q_3: \frac{33}{4}=8.25th item =30+0.25(32-30)=30.5 mm.
Median and quartiles of a discrete series
For a frequency table, add a column of cumulative frequencies (cf): each cf is the running total of the frequencies so far. The kth item is the value whose cf is the first one equal to or greater than k.
Problem. Find the median and the quartiles of the distribution below.
| x | 10 | 20 | 30 | 40 | 50 |
|---|---|---|---|---|---|
| f | 4 | 7 | 10 | 6 | 3 |
Solution.
| x | f | cf |
|---|---|---|
| 10 | 4 | 4 |
| 20 | 7 | 11 |
| 30 | 10 | 21 |
| 40 | 6 | 27 |
| 50 | 3 | 30 |
N=30.
Median: \frac{N+1}{2}=15.5th item. The first cf that is at least 15.5 is 21, belonging to x=30. So M_d=30.
Q_1: \frac{N+1}{4}=7.75th item. The first cf at least 7.75 is 11, so Q_1=20.
Q_3: \frac{3(N+1)}{4}=23.25th item. The first cf at least 23.25 is 27, so Q_3=40.
(Items 5 to 11 are all 20, so the 7.75th item lies among them; no interpolation is needed in a discrete series.)
The median of 45, 32, 50, 28, 40 is not the middle number as written (50). In order, the values are 28, 32, 40, 45, 50 and the median is 40. Always write the ordered list first. And remember that \frac{n+1}{2} is a position, not a value: for n=9 the median is the 5th item, not 5.
10.3 Mode of ungrouped and grouped data
The mode is the value that occurs most often. It is the natural average for things that are counted rather than measured: the most common shoe size, the most popular bus route, the most frequent family size.
Mode of ungrouped data
- Individual data: the value that is repeated most. In 5, 6, 6, 7, 7, 7, 8, 8, 9 the mode is 7. A set such as 2, 3, 3, 5, 5, 6 has two modes, 3 and 5 (it is bimodal); a set in which every value occurs once has no mode.
- Discrete series: the value with the highest frequency. In the mobile-phone table of section 10.1, x=3 has the highest frequency, 10, so the mode is 3 phones.
Mode of grouped data
In grouped data the class with the highest frequency is the modal class. The mode lies inside it, pulled towards whichever neighbouring class has the larger frequency.
where L is the lower limit of the modal class, f_1 its frequency, f_0 the frequency of the class before it, f_2 the frequency of the class after it, and i the class width.
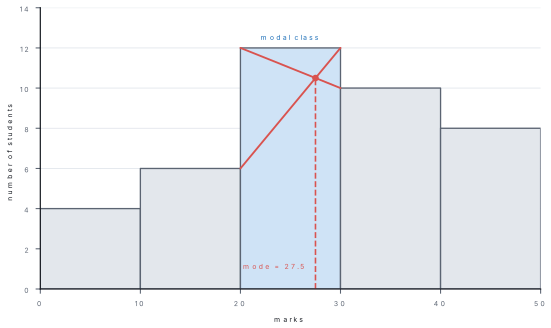
Problem. Find the mode of the marks of the 40 students in section 10.1.
Solution. The highest frequency is 12, so the modal class is 20–30. Then L=20, f_1=12, f_0=6 (class 10–20), f_2=10 (class 30–40) and i=10.
This agrees with the crossing lines on the histogram above.
Problem. The daily wages of 50 workers are given below. Find the modal wage.
| Wage (Rs) | 200–300 | 300–400 | 400–500 | 500–600 | 600–700 |
|---|---|---|---|---|---|
| Workers | 5 | 12 | 18 | 10 | 5 |
Solution. Modal class 400–500: L=400, f_1=18, f_0=12, f_2=10, i=100.
Which average should we use?
| Average | Best for | Weakness |
|---|---|---|
| Mean | measured data with no extreme values (marks, heights) | pulled by one very large or small value |
| Median | data with extreme values (incomes, house prices) | ignores the size of most values |
| Mode | the most common category (shoe size, favourite game) | may not exist, or there may be two |
In a village where nine families earn about Rs 30,000 a month and one earns Rs 5,00,000, the mean income is far above what any ordinary family earns, but the median is still close to Rs 30,000. The median describes the typical family better.
10.4 Range and coefficient of range
Two sets of data can have the same average and still be very different. The simplest measure of how spread out the data are is the range.
If L is the largest value and S the smallest value,
For grouped data, L is the upper limit of the highest class and S is the lower limit of the lowest class.
The range has the same unit as the data (marks, °C, rupees). The coefficient of range is a pure number without units, so it can compare the spread of data measured in different units, or of data of very different sizes.
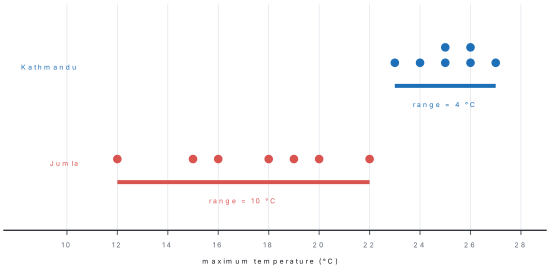
Problem. The maximum temperatures (°C) recorded on seven days of one week were (illustrative figures):
Kathmandu: 24, 26, 25, 27, 23, 25, 26. Jumla: 15, 22, 18, 12, 20, 16, 19.
Find the range and the coefficient of range for each place. Where did the temperature vary more?
Solution. Kathmandu: L=27, S=23. Range =4°C; coefficient =\frac{4}{27+23}=\frac{4}{50}=0.08.
Jumla: L=22, S=12. Range =10°C; coefficient =\frac{10}{22+12}=\frac{10}{34}\approx0.29.
Both the range and the coefficient of range are larger for Jumla, so its temperature varied more during the week.
Problem. (i) Find the range and coefficient of range for the classes 10–20, 20–30, 30–40, 40–50, 50–60. (ii) The range of a set of data is 20 and its coefficient of range is 0.25. Find the largest and smallest values.
Solution. (i) L=60 (upper limit of the last class) and S=10 (lower limit of the first class). Range =50; coefficient =\frac{50}{70}=\frac{5}{7}\approx0.71.
(ii) L-S=20 and \frac{L-S}{L+S}=0.25, so L+S=\frac{20}{0.25}=80. Adding the two equations, 2L=100, so L=50 and S=30.
The range uses only two values, the largest and the smallest, so a single unusual reading changes it a lot. It is quick to find and easy to understand, which is why weather reports use it. In grade 9 and 10 you will meet better measures of spread, such as the quartile deviation, which is built from the Q_1 and Q_3 of this chapter.
Collect one measurement from every student in your class, for example height in cm, the time taken to come to school in minutes, or the number of people at home. (1) Write the data in ascending order and find the median and the quartiles. (2) Make a frequency table (grouped into suitable classes if the values are spread out) and find the mean. (3) Find the mode, or the modal class and the mode by the formula, and draw a histogram to check it with crossing lines. (4) Find the range and coefficient of range. (5) Write three sentences about your class using the numbers you found, and say which average describes your class best and why.
Chapter summary
- Mean: \overline{X}=\frac{\sum x}{n} (individual), \frac{\sum fx}{N} (discrete), \frac{\sum fm}{N} (continuous, m = mid-value); N=\sum f.
- Median: arrange in order; M_d = value of the \left(\frac{n+1}{2}\right)th item; for a frequency table use cumulative frequencies.
- Quartiles: Q_1 = \left(\frac{n+1}{4}\right)th item, Q_3 = \left(\frac{3(n+1)}{4}\right)th item; interpolate between neighbours in individual data.
- Mode: the most frequent value; for grouped data M_o=L+\frac{f_1-f_0}{2f_1-f_0-f_2}\times i in the modal class.
- Choose the mean for ordinary measured data, the median when there are extreme values, the mode for the most common category.
- Range =L-S; coefficient of range =\frac{L-S}{L+S}, a number without units used to compare spreads.
Practice questions
Group A — Objective (1 mark each)
- The mean of 4, 6, 8, 10 and 12 is [1]a6b8c10d40
- If the mean of 5 numbers is 12, their sum is [1]a17b60c2.4d7
- To find the mean of a continuous series we multiply the frequencies by the [1]aupper limitsblower limitscmid-valuesdcumulative frequencies
- The median of 3, 7, 9, 12, 15 is [1]a7b9c9.2d12
- The median of 2, 5, 8, 11 is [1]a5b8c6.5d6
- For n items in ascending order, the position of Q_1 is [1]a\frac{n}{4}b\frac{n+1}{4}c\frac{n+1}{2}d\frac{3(n+1)}{4}
- If n=11, the third quartile is the [1]a3rd itemb6th itemc9th itemd8th item
- The mode of 2, 4, 4, 5, 7, 7, 7, 9 is [1]a4b5c7d9
- In M_o=L+\frac{f_1-f_0}{2f_1-f_0-f_2}\times i, the symbol f_1 stands for the [1]afrequency of the modal classbtotal frequencycclass widthdlower limit
- The range of 15, 8, 22, 11, 30 is [1]a22b15c30d8
- If the largest value is 40 and the smallest is 10, the coefficient of range is [1]a30b0.6c0.25d4
- For the classes 0–10, 10–20, 20–30, the mid-value of the second class is [1]a10b15c20d30
Answers to Group A
1. (b) — \frac{40}{5}=8.
2. (b) — sum = mean \times number =12\times5.
3. (c) — each class is represented by its mid-value.
4. (b) — the 3rd of 5 ordered items.
5. (c) — \frac{5+8}{2}=6.5.
6. (b) — Q_1 is the \frac{n+1}{4}th item.
7. (c) — \frac{3(11+1)}{4}=9.
8. (c) — 7 occurs three times.
9. (a) — f_1 is the frequency of the modal class itself.
10. (a) — 30-8=22.
11. (b) — \frac{40-10}{40+10}=\frac{30}{50}=0.6.
12. (b) — \frac{10+20}{2}=15.
Group B — Short answer (2 marks each)
- Find the mean of 12, 15, 18, 20, 25 and 30. [2]
- The mean of 6, 9, x, 15 and 18 is 12. Find x. [2]
- Find the mean of the distribution: x: 2, 4, 6, 8 with f: 3, 5, 8, 4. [2]
- Find the median of 45, 32, 50, 28, 40, 36, 48. [2]
- Find the median of 14, 20, 11, 25, 18, 16. [2]
- Find the quartiles Q_1 and Q_3 of 4, 7, 9, 12, 15, 18, 21. [2]
- Find the mode of the distribution: x: 5, 10, 15, 20, 25 with f: 3, 8, 12, 7, 2. [2]
- Find the range and the coefficient of range of 23, 45, 31, 52, 38. [2]
- Find the mean of the grouped data: 0–4: 2, 4–8: 5, 8–12: 8, 12–16: 5. [2]
- Find the modal class and the mode: 10–20: 4, 20–30: 9, 30–40: 15, 40–50: 7, 50–60: 5. [2]
Answers to Group B
1. \sum x=120 and n=6, so \overline{X}=20.
2. The total is 12\times5=60, so 6+9+x+15+18=60, giving 48+x=60 and x=12.
3. N=20 and \sum fx=6+20+48+32=106, so \overline{X}=\frac{106}{20}=5.3.
4. In order: 28, 32, 36, 40, 45, 48, 50. The median is the 4th item, 40.
5. In order: 11, 14, 16, 18, 20, 25 (n=6). The median is the 3.5th item, \frac{16+18}{2}=17.
6. n=7: Q_1 is the \frac{8}{4}=2nd item, 7; Q_3 is the \frac{24}{4}=6th item, 18.
7. The highest frequency, 12, belongs to x=15, so the mode is 15.
8. Range =52-23=29; coefficient =\frac{29}{52+23}=\frac{29}{75}\approx0.39.
9. Mid-values 2, 6, 10, 14; \sum fm=4+30+80+70=184; N=20; \overline{X}=\frac{184}{20}=9.2.
10. Modal class 30–40 (f_1=15, f_0=9, f_2=7, L=30, i=10): M_o=30+\frac{15-9}{30-9-7}\times10=30+\frac{6}{14}\times10\approx34.29.
Group C — Long answer (4 marks each)
- The marks of 40 students are: 0–10: 3, 10–20: 7, 20–30: 12, 30–40: 10, 40–50: 8. Find (i) the mean (ii) the mode. [4]
- Find the median, Q_1 and Q_3 of 21, 35, 18, 42, 27, 30, 25, 38, 33, 29, 40. [4]
- For the distribution x: 5, 10, 15, 20, 25, 30 with frequencies f: 2, 5, 8, 10, 4, 1, find the median, the quartiles Q_1 and Q_3, the mode and the mean. [4]
- The mean of the distribution x: 10, 20, 30, 40 with frequencies f: 4, 6, p, 3 is 25. Find p, and then find the median. [4]
- The maximum temperatures (°C) on seven days were: Kathmandu 24, 26, 25, 27, 23, 25, 26; Jumla 15, 22, 18, 12, 20, 16, 19. (i) Find the range and the coefficient of range for each place. (ii) Find the mean temperature of each place. (iii) Which place had the more variable temperature? [4]
Answers to Group C
1. (i) Mid-values 5, 15, 25, 35, 45; \sum fm=15+105+300+350+360=1130; N=40; \overline{X}=\frac{1130}{40}=28.25 marks. (ii) Modal class 20–30 with L=20, f_1=12, f_0=7, f_2=10, i=10: M_o=20+\frac{12-7}{24-7-10}\times10=20+\frac{5}{7}\times10\approx27.14 marks.
2. In order: 18, 21, 25, 27, 29, 30, 33, 35, 38, 40, 42 (n=11). Median: \frac{12}{2}=6th item =30. Q_1: \frac{12}{4}=3rd item =25. Q_3: \frac{36}{4}=9th item =38.
3. Cumulative frequencies: 2, 7, 15, 25, 29, 30; N=30. Median: 15.5th item; the first cf at least 15.5 is 25, so M_d=20. Q_1: 7.75th item, cf 15, so Q_1=15. Q_3: 23.25th item, cf 25, so Q_3=20. Mode: highest frequency 10, so M_o=20. Mean: \sum fx=10+50+120+200+100+30=510, \overline{X}=\frac{510}{30}=17.
4. N=13+p and \sum fx=40+120+30p+120=280+30p. Then 25(13+p)=280+30p, so 325+25p=280+30p, 5p=45 and p=9. Check: N=22, \sum fx=550, \frac{550}{22}=25 ✓. Median: cumulative frequencies 4, 10, 19, 22; the \frac{23}{2}=11.5th item falls where cf first reaches 19, so M_d=30.
5. (i) Kathmandu: range 27-23=4°C, coefficient \frac{4}{50}=0.08. Jumla: range 22-12=10°C, coefficient \frac{10}{34}\approx0.29. (ii) Kathmandu: \frac{176}{7}\approx25.14°C; Jumla: \frac{122}{7}\approx17.43°C. (iii) Jumla, because both its range and its coefficient of range are larger.
Practise more: Optional Mathematics question bank