Unit 11 · Units · 13 min read
Statistics: Measures of Dispersion
What the syllabus asks for 4
- Quartile deviation and its coefficient
- Mean deviation and its coefficient
- Standard deviation, variance and coefficient of variation
- Exercises of the SEE type
Two classes can have the same average mark and still be very different: in one every student scores close to the average, in the other some score very high and some very low. The average does not tell us how spread out the data are. This spread is measured by a measure of dispersion. In this chapter you learn three of them: the quartile deviation (which ignores extreme values), the mean deviation (the average distance from the mean), and the standard deviation (the most important, the basis of all later statistics). You also learn the coefficient of variation, used to decide which of two sets of data is more consistent.
Expect (i) the quartiles, quartile deviation and its coefficient from individual, discrete or grouped data; (ii) the mean deviation and its coefficient; (iii) the standard deviation, variance and coefficient of variation, often by the step-deviation method for a grouped table; (iv) "which is more consistent?" — answered by comparing coefficients of variation (the smaller is the more consistent). Show every column of the table; the marks follow the working.
11.1 Quartile deviation and its coefficient
Quartiles
Arrange the data in ascending order. The quartiles split it into four equal parts.
| Quartile | Meaning |
|---|---|
| Q_1 (lower quartile) | 25% of the data lie below it |
| Q_2 (median) | 50% lie below it |
| Q_3 (upper quartile) | 75% lie below it |
The quartile deviation (semi-interquartile range) is half the distance between the upper and the lower quartile:
The coefficient of quartile deviation is a pure number (no units), which allows two data sets with different units to be compared:
Quartiles from individual and discrete data
For n items (or total frequency N) in ascending order:
If the position is a fraction, e.g. 2.5, take the value halfway between the 2nd and 3rd items (in general, move that fraction of the way from one to the next). For a discrete frequency table build the cumulative frequency (c.f.) column; Q is the value whose c.f. is the first to reach or pass the position.
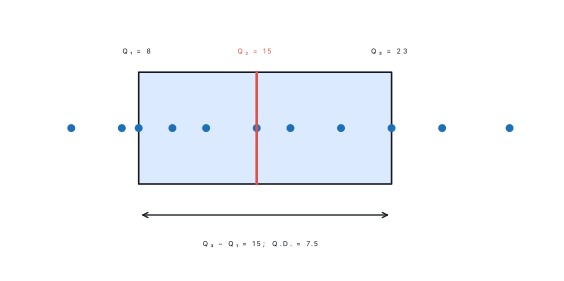
Problem. Find the quartile deviation and its coefficient for the marks 30, 4, 12, 8, 26, 10, 15, 7, 20, 17, 23.
Solution. Arrange: 4,\ 7,\ 8,\ 10,\ 12,\ 15,\ 17,\ 20,\ 23,\ 26,\ 30. n=11.
Q_1=\left(\dfrac{11+1}{4}\right)^{\text{th}}=3^{\text{rd}} item =8. Q_3=3\left(\dfrac{12}{4}\right)^{\text{th}}=9^{\text{th}} item =23.
Problem. Find the quartile deviation and its coefficient.
| Marks x | 10 | 20 | 30 | 40 | 50 |
|---|---|---|---|---|---|
| Frequency f | 5 | 9 | 12 | 8 | 6 |
Solution. Cumulative frequencies: 5,\ 14,\ 26,\ 34,\ 40. N=40.
Q_1 position =\dfrac{N+1}{4}=\dfrac{41}{4}=10.25. The first c.f. \geq 10.25 is 14, so Q_1=20.
Q_3 position =3\times\dfrac{41}{4}=30.75. The first c.f. \geq 30.75 is 34, so Q_3=40.
Quartiles from grouped (continuous) data
For a frequency table with classes, find the class that contains the quartile, then interpolate:
Let N=\sum f. The Q_1 class is the one whose c.f. first reaches or exceeds \dfrac N4; the Q_3 class, \dfrac{3N}{4}.
l = lower limit of the quartile class, f = its frequency, c.f. = c.f. of the class before it, i = class width.
Problem. The marks of 50 students in a Grade 9 test are given. Find Q_1, Q_3, the quartile deviation and its coefficient.
| Marks | 20–30 | 30–40 | 40–50 | 50–60 | 60–70 | 70–80 | 80–90 |
|---|---|---|---|---|---|---|---|
| Students f | 4 | 5 | 10 | 15 | 8 | 7 | 1 |
| c.f. | 4 | 9 | 19 | 34 | 42 | 49 | 50 |
Solution. N=50.
Q_1: \dfrac N4=12.5. The first c.f. \geq 12.5 is 19, so the Q_1 class is 40–50: l=40, c.f.=9, f=10, i=10.
Q_3: \dfrac{3N}{4}=37.5. The first c.f. \geq 37.5 is 42, so the class is 60–70: l=60, c.f.=34, f=8, i=10.
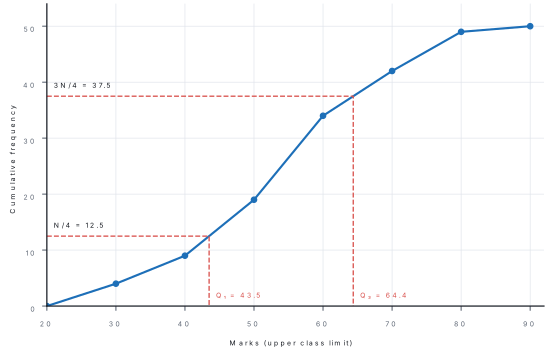
For individual and discrete data we use \dfrac{n+1}{4}. For grouped (continuous) data we use \dfrac N4 with the interpolation formula. Mixing the two is the commonest reason for an answer that does not match the key. Also, the c.f. in the formula is that of the class before the quartile class.
11.2 Mean deviation and its coefficient
The quartile deviation uses only two values. The mean deviation uses every observation: it is the average distance of the observations from the mean (or median).
The mean deviation about the mean \bar x is the arithmetic mean of the absolute deviations |x-\bar x|:
The coefficient of mean deviation is
(In the same way the mean deviation about the median uses |x-\text{median}| and divides by the median.) For grouped data, x is the class mid-value.
Why the absolute value? The plain deviations x-\bar x always add to zero (positive and negative cancel), so they tell us nothing; the absolute deviations do not cancel.
Problem. Find the mean deviation about the mean of 5,\ 8,\ 10,\ 12,\ 15, and its coefficient.
Solution. \bar x=\dfrac{5+8+10+12+15}{5}=\dfrac{50}{5}=10.
| x | 5 | 8 | 10 | 12 | 15 | Total |
|---|---|---|---|---|---|---|
| \|x-10\| | 5 | 2 | 0 | 2 | 5 | 14 |
Problem. Find the mean deviation about the mean and its coefficient.
| x | 2 | 4 | 6 | 8 | 10 |
|---|---|---|---|---|---|
| f | 2 | 4 | 8 | 4 | 2 |
Solution. N=20, \sum fx=4+16+48+32+20=120, so \bar x=\dfrac{120}{20}=6.
| x | f | fx | \|x-6\| | f\|x-6\| |
|---|---|---|---|---|
| 2 | 2 | 4 | 4 | 8 |
| 4 | 4 | 16 | 2 | 8 |
| 6 | 8 | 48 | 0 | 0 |
| 8 | 4 | 32 | 2 | 8 |
| 10 | 2 | 20 | 4 | 8 |
| Total | 20 | 120 | 32 |
Problem. Find the mean deviation about the mean and its coefficient.
| Class | 0–10 | 10–20 | 20–30 | 30–40 | 40–50 |
|---|---|---|---|---|---|
| f | 5 | 8 | 15 | 16 | 6 |
Solution. N=50. Mid-values m=5,15,25,35,45.
| Class | f | m | fm | \|m-27\| | f\|m-27\| |
|---|---|---|---|---|---|
| 0–10 | 5 | 5 | 25 | 22 | 110 |
| 10–20 | 8 | 15 | 120 | 12 | 96 |
| 20–30 | 15 | 25 | 375 | 2 | 30 |
| 30–40 | 16 | 35 | 560 | 8 | 128 |
| 40–50 | 6 | 45 | 270 | 18 | 108 |
| Total | 50 | 1350 | 472 |
\bar x=\dfrac{1350}{50}=27 (so the column |m-27| was filled after finding the mean).
(1) The mean found first, with its working. (2) A table with a separate column for |x-\bar x| (and f|x-\bar x|). (3) The formula, the substitution and the answer with units, if any. (4) The coefficient as a number without units.
11.3 Standard deviation, variance and coefficient of variation
The mean deviation uses absolute values, which are awkward in algebra. The standard deviation squares the deviations instead — the squares are positive and also easy to handle algebraically.
The standard deviation \sigma is the square root of the mean of the squared deviations from the mean. Its square is the variance \sigma^2.
The coefficient of standard deviation is \dfrac{\sigma}{\bar x}, and the coefficient of variation is
Computing every deviation x-\bar x is slow when \bar x is not a whole number. This result avoids it.
Step 1 — expand the square.
Step 2 — use \sum x=n\bar x.
Step 3 — divide by n.
Result.
What it means. Variance is "the mean of the squares minus the square of the mean". For a frequency table replace \sum x^2 by \sum fx^2, \sum x by \sum fx and n by N.
Choose an assumed mean A (a mid-value near the middle) and let d=\dfrac{m-A}{h} where m is the mid-value. Then
The numbers d are small integers (\dots,-2,-1,0,1,2,\dots), so the arithmetic is short.
Problem. Find the standard deviation of 2,\ 4,\ 4,\ 4,\ 5,\ 5,\ 7,\ 9.
Solution. n=8, \sum x=40, so \bar x=5.
| x | 2 | 4 | 4 | 4 | 5 | 5 | 7 | 9 | Total |
|---|---|---|---|---|---|---|---|---|---|
| x-5 | −3 | −1 | −1 | −1 | 0 | 0 | 2 | 4 | 0 |
| (x-5)^2 | 9 | 1 | 1 | 1 | 0 | 0 | 4 | 16 | 32 |
Check by the short-cut: \sum x^2=4+16+16+16+25+25+49+81=232, so \sigma^2=\dfrac{232}{8}-5^2=29-25=4 and \sigma=2. ✓ Variance =4; \text{C.V.}=\dfrac25\times100=40\%.
Problem. For 10 observations, \sum x=100 and \sum x^2=1090. Find the mean, variance and standard deviation.
Solution. \bar x=\dfrac{100}{10}=10. \sigma^2=\dfrac{1090}{10}-10^2=109-100=9. \sigma=3.
Problem. Find the standard deviation and the coefficient of variation.
| x | 10 | 20 | 30 | 40 | 50 |
|---|---|---|---|---|---|
| f | 1 | 2 | 3 | 5 | 4 |
Solution. N=15.
| x | f | fx | x^2 | fx^2 |
|---|---|---|---|---|
| 10 | 1 | 10 | 100 | 100 |
| 20 | 2 | 40 | 400 | 800 |
| 30 | 3 | 90 | 900 | 2700 |
| 40 | 5 | 200 | 1600 | 8000 |
| 50 | 4 | 200 | 2500 | 10000 |
| Total | 15 | 540 | 21600 |
\bar x=\dfrac{540}{15}=36. \sigma^2=\dfrac{21600}{15}-36^2=1440-1296=144, so \sigma=12.
Problem. Find the mean and standard deviation.
| Class | 0–10 | 10–20 | 20–30 | 30–40 | 40–50 |
|---|---|---|---|---|---|
| f | 1 | 2 | 4 | 8 | 5 |
Solution. N=20, h=10. Take A=35 and d=\dfrac{m-35}{10}.
| Class | f | m | d | fd | fd^2 |
|---|---|---|---|---|---|
| 0–10 | 1 | 5 | −3 | −3 | 9 |
| 10–20 | 2 | 15 | −2 | −4 | 8 |
| 20–30 | 4 | 25 | −1 | −4 | 4 |
| 30–40 | 8 | 35 | 0 | 0 | 0 |
| 40–50 | 5 | 45 | 1 | 5 | 5 |
| Total | 20 | −6 | 26 |
(Direct check: \sum fm=640, \bar x=32 ✓; \sum fm^2=22900, \sigma^2=1145-1024=121 ✓.)
Coefficient of variation: which is more consistent?
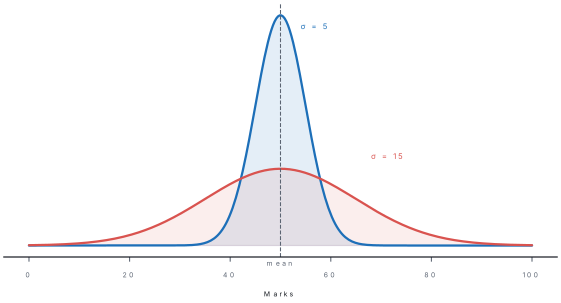
A measure like \sigma has the same units as the data, so to compare data in different units or with very different means we use the coefficient of variation. The smaller the C.V., the more consistent (less variable) the data.
Problem. In 10 matches, batsman A scored a mean of 50 runs with \sigma=10; batsman B a mean of 80 runs with \sigma=12. Who is more consistent?
Solution. \text{C.V.}_A=\dfrac{10}{50}\times100=20\%. \text{C.V.}_B=\dfrac{12}{80}\times100=15\%.
B has the smaller C.V., so B is more consistent, even though B's \sigma is larger.
Compare C.V., not \sigma, when the means differ. A \sigma of 12 is large for a mean of 20 but small for a mean of 80. Also remember: in the formula for the C.V. you multiply by 100; and for grouped data use class mid-values.
11.4 Exercises of the SEE type
Method for any question
- Identify the data type: individual, discrete or grouped.
- Q.D.: arrange in order; (n+1)/4 positions for individual and discrete data; N/4 and the interpolation formula for grouped data.
- M.D.: find the mean first; then |x-\bar x| and f|x-\bar x| columns.
- S.D.: use d, fd, fd^2 columns (step deviation) for a grouped table; check with \sigma^2=\dfrac{\sum fx^2}{N}-\bar x^2.
- For "more consistent", compute both C.V.s and choose the smaller.
Chapter summary
- Quartiles: Q_1, Q_2, Q_3 divide ordered data into four parts. Positions: \frac{n+1}{4} and \frac{3(n+1)}{4} (individual/discrete); \frac N4 and \frac{3N}{4} with Q=l+\frac{\frac{kN}{4}-c.f.}{f}\times i (grouped).
- Quartile deviation =\dfrac{Q_3-Q_1}{2}; coefficient =\dfrac{Q_3-Q_1}{Q_3+Q_1}.
- Mean deviation =\dfrac{\sum f|x-\bar x|}{N}; coefficient =\dfrac{\text{M.D.}}{\bar x}.
- Standard deviation \sigma=\sqrt{\dfrac{\sum f(x-\bar x)^2}{N}}=\sqrt{\dfrac{\sum fx^2}{N}-\bar x^2}; variance =\sigma^2.
- Step deviation: d=\dfrac{m-A}{h}; \bar x=A+\dfrac{\sum fd}{N}h; \sigma=h\sqrt{\dfrac{\sum fd^2}{N}-\left(\dfrac{\sum fd}{N}\right)^2}.
- Coefficient of variation =\dfrac{\sigma}{\bar x}\times100\%; the smaller C.V. means more consistent data.
Practice questions
Group A — Multiple choice (1 mark each)
- The quartile deviation is [1]aQ_3-Q_1b\frac{Q_3+Q_1}{2}c\frac{Q_3-Q_1}{2}d\frac{Q_3-Q_1}{Q_3+Q_1}
- The sum of the deviations of the observations from their mean is always [1]a1b0cndnegative
- The variance is the [1]asquare root of S.D.bsquare of S.D.ctwice the S.D.dmean deviation squared
- If \sigma=6 and \bar x=30, the coefficient of variation is [1]a5\%b20\%c180\%d36\%
- Of two data sets, the more consistent has the [1]alarger meanblarger \sigmacsmaller C.V.dlarger C.V.
Answers to Group A
1. (c) — half the interquartile range.
2. (b) — positive and negative deviations cancel.
3. (b) — \text{variance}=\sigma^2.
4. (b) — \frac{6}{30}\times100=20\%.
5. (c) — smaller C.V. means less relative variation.
Group B — Short answer (2 marks each)
- Find the quartile deviation of 5,10,15,20,25,30,35 and its coefficient. [2]
- Find the mean deviation about the mean of 2,4,6,8,10. [2]
- Find the standard deviation of 1,2,3,4,5. [2]
- If the mean is 40 and the standard deviation is 8, find the coefficient of variation. [2]
Answers to Group B
1. n=7: Q_1=2^{\text{nd}} item =10, Q_3=6^{\text{th}} item =30. Q.D. =\frac{30-10}{2}=10; coefficient =\frac{20}{40}=0.5.
2. \bar x=6; |x-6|=4,2,0,2,4, sum 12; M.D. =\frac{12}{5}=2.4.
3. \bar x=3; squared deviations 4,1,0,1,4, sum 10; \sigma=\sqrt{10/5}=\sqrt{2}\approx1.414.
4. C.V. =\frac{8}{40}\times100=20\%.
Group C — Short answer (3 marks each)
- Find the quartile deviation and its coefficient for the grouped data: classes 10–20, 20–30, 30–40, 40–50 with frequencies 3,5,8,4. [3]
- Find the mean deviation about the mean of 12,15,18,21,24 and its coefficient. [3]
- For 10 observations \sum x=50 and \sum x^2=290. Find the mean, variance and standard deviation. [3]
- Shop A has mean daily sales Rs 120 with \sigma=18; shop B has mean Rs 150 with \sigma=24. Which shop's sales are more consistent? [3]
Answers to Group C
1. N=20; c.f. =3,8,16,20. \frac N4=5: class 20–30 (c.f.=3, f=5): Q_1=20+\frac{5-3}{5}\times10=24. \frac{3N}{4}=15: class 30–40 (c.f.=8, f=8): Q_3=30+\frac{15-8}{8}\times10=38.75. Q.D. =\frac{38.75-24}{2}=7.375. Coefficient =\frac{14.75}{62.75}\approx0.235.
2. \bar x=18; |x-18|=6,3,0,3,6, sum 18; M.D. =\frac{18}{5}=3.6; coefficient =\frac{3.6}{18}=0.2.
3. \bar x=5; \sigma^2=\frac{290}{10}-25=29-25=4; \sigma=2.
4. C.V._A=\frac{18}{120}\times100=15\%; C.V._B=\frac{24}{150}\times100=16\%. A has the smaller C.V., so shop A is more consistent.
Group D — Long answer (4 marks each)
- Find the mean deviation about the mean and its coefficient: classes 0–10, 10–20, 20–30, 30–40, 40–50 with frequencies 2,4,8,4,2. [4]
- Find the standard deviation and the coefficient of variation: x=10,20,30,40,50 with f=2,4,6,5,3. [4]
- Show that \sigma^2=\dfrac{\sum x^2}{n}-\bar x^2. [4]
- For 20 observations \sum x=400 and \sum x^2=8500. Find the mean, the standard deviation and the coefficient of variation. [4]
Answers to Group D
1. N=20; m=5,15,25,35,45; \sum fm=10+60+200+140+90=500; \bar x=25. |m-25|=20,10,0,10,20; f|m-25|=40,40,0,40,40, sum 160. M.D. =\frac{160}{20}=8; coefficient =\frac{8}{25}=0.32.
2. N=20. \sum fx=20+80+180+200+150=630, \bar x=31.5. \sum fx^2=200+1600+5400+8000+7500=22700. \sigma^2=\frac{22700}{20}-31.5^2=1135-992.25=142.75; \sigma=\sqrt{142.75}\approx11.95. C.V. =\frac{11.95}{31.5}\times100\approx37.9\%.
3. See the derivation: \sum(x-\bar x)^2=\sum x^2-2\bar x\sum x+n\bar x^2=\sum x^2-n\bar x^2; divide by n.
4. \bar x=\frac{400}{20}=20. \sigma^2=\frac{8500}{20}-20^2=425-400=25; \sigma=5. C.V. =\frac{5}{20}\times100=25\%.
Practise more: Optional Mathematics question bank