Unit 17 · Compulsory Mathematics · 12 min read
Statistics
What the syllabus asks for 2
- Statistics: concepts, formulas and worked problems
- Exercises of the SEE type
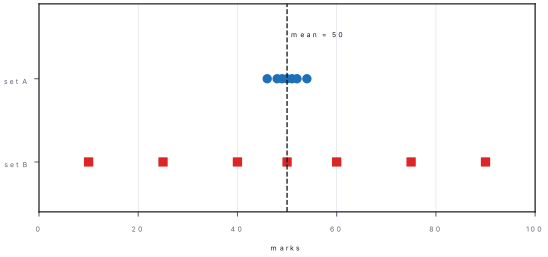
An average tells us where the middle of a set of data lies, but it does not say how spread out the data are. Two classes can both have an average mark of 50, yet in one class every student scored between 45 and 55 while in the other the marks run from 5 to 95. To describe this spread we use measures of dispersion: the range, the quartile deviation, the mean deviation and the standard deviation. Each has a relative version, a coefficient, which has no unit and lets us compare data measured in different units. This chapter shows how to calculate all of them for individual, discrete and continuous data, and how to decide which set of data is more consistent.
Expect: (i) range and its coefficient; (ii) quartile deviation and its coefficient, from a frequency table (3–4 marks); (iii) mean deviation and coefficient; (iv) standard deviation and variance, often by the step-deviation method; (v) a comparison using the coefficient of variation: "which team is more consistent?". Write the formula, the table, the substitution and the final answer with the right unit (a coefficient has none).
17.1 Statistics: concepts, formulas and worked problems
Recall: measures of central tendency
| Measure | Individual data | Continuous data |
|---|---|---|
| Mean | \bar x=\frac{\sum x}{n} | \bar x=\frac{\sum fm}{n} (m = mid-value of the class) |
| Median | middle value of the ordered list | L+\frac{\frac{n}{2}-cf}{f}\times h |
| Mode | most frequent value | L+\frac{f_1-f_0}{2f_1-f_0-f_2}\times h |
Here L is the lower boundary of the median class, cf the cumulative frequency before it, f its frequency and h the class width.
Why we need dispersion
| Measure | Formula | Coefficient (relative) |
|---|---|---|
| Range | R=L-S | \frac{L-S}{L+S} |
| Quartile deviation | QD=\frac{Q_3-Q_1}{2} | \frac{Q_3-Q_1}{Q_3+Q_1} |
| Mean deviation | MD=\frac{\sum f\,\mid x-\bar x\mid}{n} | \frac{MD}{\bar x} |
| Standard deviation | \sigma=\sqrt{\frac{\sum f(x-\bar x)^2}{n}} | CV=\frac{\sigma}{\bar x}\times100\% |
L and S are the largest and smallest values. The variance is \sigma^2.
Range
The range is the difference between the largest and the smallest value. It is quick but uses only two values and is badly affected by one extreme value.
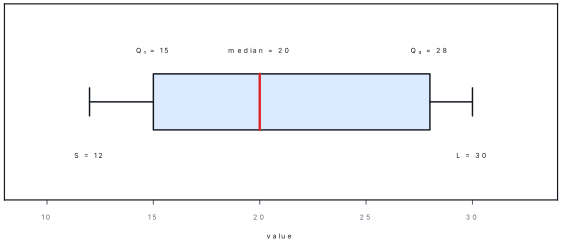
Problem. Find the range and coefficient of range of 12, 15, 18, 20, 25, 28, 30.
Solution. L=30 and S=12.
Quartile deviation
Quartiles divide ordered data into four equal parts: Q_1 (lower quartile) has 25% of the data below it, Q_2 is the median and Q_3 (upper quartile) has 75% below it. The quartile deviation (semi-interquartile range) ignores the extreme quarters, so it is not disturbed by outliers.
Individual and discrete data (arrange in ascending order, n = number of items):
Continuous data: find the class containing the \frac{n}{4}th (or \frac{3n}{4}th) item using the cumulative frequency, then
Problem. Find QD and its coefficient for 12, 15, 18, 20, 25, 28, 30.
Solution. The data are already in order and n=7.
Q_1 is the \frac{7+1}{4}=2nd item =15. Q_3 is the \frac{3\times8}{4}=6th item =28.
Problem. Marks of 20 students: 5 (2 students), 6 (5), 7 (8), 8 (4), 9 (1). Find QD and its coefficient.
Solution. Build the cumulative frequency.
| Marks x | 5 | 6 | 7 | 8 | 9 |
|---|---|---|---|---|---|
| f | 2 | 5 | 8 | 4 | 1 |
| cf | 2 | 7 | 15 | 19 | 20 |
n=20. Q_1 is the \frac{21}{4}=5.25th item: the first cf that is at least 5.25 is 7, so Q_1=6. Q_3 is the \frac{3\times21}{4}=15.75th item: the first cf\geq15.75 is 19, so Q_3=8.
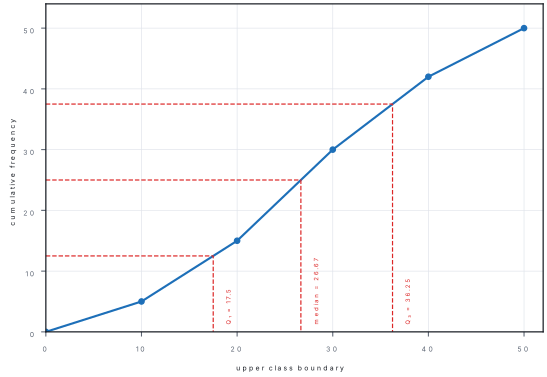
Problem. Find QD and its coefficient for the following distribution.
| Class | 0–10 | 10–20 | 20–30 | 30–40 | 40–50 |
|---|---|---|---|---|---|
| f | 5 | 10 | 15 | 12 | 8 |
| cf | 5 | 15 | 30 | 42 | 50 |
Solution. n=50.
\frac{n}{4}=12.5: the first cf\geq12.5 is 15, so Q_1 lies in the class 10–20 with L=10, cf=5, f=10, h=10:
\frac{3n}{4}=37.5: the first cf\geq37.5 is 42, so Q_3 lies in 30–40 with L=30, cf=30, f=12:
Mean deviation
The mean deviation is the average distance of the values from their mean (the absolute value ignores the sign, so the deviations do not cancel).
Problem. Find the mean deviation and its coefficient of 4, 6, 8, 10, 12.
Solution. \bar x=\frac{40}{5}=8. The deviations |x-8| are 4,2,0,2,4, with sum 12.
Problem. Find the mean deviation of the data.
| x | 10 | 20 | 30 | 40 | 50 |
|---|---|---|---|---|---|
| f | 1 | 1 | 7 | 5 | 6 |
Solution. n=20 and \sum fx=10+20+210+200+300=740, so \bar x=37.
| x | f | \mid x-37\mid | f\mid x-37\mid |
|---|---|---|---|
| 10 | 1 | 27 | 27 |
| 20 | 1 | 17 | 17 |
| 30 | 7 | 7 | 49 |
| 40 | 5 | 3 | 15 |
| 50 | 6 | 13 | 78 |
\sum f|x-\bar x|=186, so
Problem. Class intervals 0–10, 10–20, 20–30, 30–40, 40–50 have frequencies 1, 2, 8, 14, 15. Find MD about the mean.
Solution. Mid-values m=5,15,25,35,45; n=40. \sum fm=5+30+200+490+675=1400, so \bar x=35. Deviations |m-35|=30,20,10,0,10. Then \sum f|m-\bar x|=30+40+80+0+150=300, and
Standard deviation
The standard deviation \sigma (the square root of the mean of the squared deviations) is the most widely used measure of spread. The square makes every deviation positive and gives more weight to far-out values.
Properties. Adding a constant to every value does not change \sigma. Multiplying every value by k multiplies \sigma by |k|. Variance =\sigma^2.
Setting up. Start from the definition \sigma^2=\frac{\sum f(x-\bar x)^2}{n}.
Step 1 — expand the bracket.
Step 2 — replace the sums. \sum fx=n\bar x and \sum f=n, so
Step 3 — divide by n.
Result. \sigma=\sqrt{\frac{\sum fx^2}{n}-\bar x^2}.
What it means. The variance is "the mean of the squares minus the square of the mean", which avoids subtracting the mean from every value.
Problem. Find the standard deviation of 2, 4, 4, 4, 5, 5, 7, 9.
Solution. \bar x=\frac{40}{8}=5. Deviations from 5: -3,-1,-1,-1,0,0,2,4; squares 9,1,1,1,0,0,4,16, sum 32.
Check by the short-cut method: \sum x^2=4+16+16+16+25+25+49+81=232, so \frac{232}{8}-5^2=29-25=4 and \sigma=2 ✓.
Problem. Find \sigma for x=10,20,30,40,50 with f=1,1,7,5,6.
Solution. n=20, \bar x=37.
| x | f | x-37 | (x-37)^2 | f(x-37)^2 |
|---|---|---|---|---|
| 10 | 1 | -27 | 729 | 729 |
| 20 | 1 | -17 | 289 | 289 |
| 30 | 7 | -7 | 49 | 343 |
| 40 | 5 | 3 | 9 | 45 |
| 50 | 6 | 13 | 169 | 1014 |
\sum f(x-\bar x)^2=2420, so \sigma^2=\frac{2420}{20}=121 and \sigma=11.
Problem. Class intervals 0–10, 10–20, 20–30, 30–40, 40–50 with frequencies 1, 2, 8, 14, 15. Find \sigma and the variance.
Solution. Take A=35 and h=10; d'=\frac{m-35}{10}.
| Class | f | m | d' | fd' | fd'^2 |
|---|---|---|---|---|---|
| 0–10 | 1 | 5 | -3 | -3 | 9 |
| 10–20 | 2 | 15 | -2 | -4 | 8 |
| 20–30 | 8 | 25 | -1 | -8 | 8 |
| 30–40 | 14 | 35 | 0 | 0 | 0 |
| 40–50 | 15 | 45 | 1 | 15 | 15 |
| Total | 40 | 0 | 40 |
The mean is A+h\frac{\sum fd'}{n}=35+0=35.
Problem. For 10 observations \sum x=50 and \sum x^2=300. Find the mean, variance and standard deviation.
Solution. \bar x=\frac{50}{10}=5; variance =\frac{300}{10}-5^2=30-25=5; \sigma=\sqrt{5}=2.24.
Problem. The standard deviation of a set of marks is 6. What is the standard deviation if 5 marks are added to every score? If every score is doubled?
Solution. Adding 5 shifts the whole set and leaves the spread unchanged: \sigma=6. Doubling doubles every distance: \sigma=2\times6=12.
Coefficient of variation and consistency
A larger \sigma does not always mean more scattered data, because it depends on the size of the numbers. The coefficient of variation
measures the spread relative to the mean. The data set with the smaller CV is more consistent (more uniform).
Problem. Team A has mean score 50 with \sigma=5; team B has mean 40 with \sigma=6. Which is more consistent?
Solution. CV_A=\frac{5}{50}\times100=10\% and CV_B=\frac{6}{40}\times100=15\%. Team A has the smaller CV, so team A is more consistent.
Problem. In 5 tests, Ram's marks have mean 60 and \sigma=9; Sita's have mean 75 and \sigma=9. Who is more consistent?
Solution. CV_{\text{Ram}}=\frac{9}{60}\times100=15\%; CV_{\text{Sita}}=\frac{9}{75}\times100=12\%. Sita is more consistent, even though the two standard deviations are equal, because her mean is larger.
- Forgetting to arrange the data in ascending order before finding the quartiles.
- Using \frac{n}{4} for individual data (use \frac{n+1}{4}) or using \frac{n+1}{4} for continuous data (use \frac{n}{4}).
- Taking |x-\bar x| with a negative sign in the mean deviation, or dividing by the number of classes instead of n=\sum f.
- Using the class boundary instead of the mid-value for x in continuous data.
- Writing "%" or a unit after a coefficient of range/QD/MD (coefficients have no unit; only CV is a percentage).
- Comparing consistency with \sigma instead of CV.
17.2 Exercises of the SEE type
Method for any question
- Identify the data type: individual, discrete or continuous.
- For quartiles: order the data, build cf, locate the quartile positions.
- For MD and \sigma: find \bar x first; then build a clear table with the columns you need.
- Substitute into the formula and calculate carefully; keep three decimals until the end.
- Write the answer with a statement ("Hence team A is more consistent").
Problem. The marks of 11 students: 24, 38, 14, 45, 30, 20, 50, 27, 35, 42, 18. Find the quartile deviation and its coefficient.
Solution. In order: 14, 18, 20, 24, 27, 30, 35, 38, 42, 45, 50 (n=11). Q_1 is the \frac{12}{4}=3rd item =20 and Q_3 is the \frac{36}{4}=9th item =42.
Problem. Find the standard deviation and coefficient of variation of the marks 6, 8, 10, 12, 14.
Solution. \bar x=10. Squared deviations: 16,4,0,4,16, sum 40. \sigma=\sqrt{\frac{40}{5}}=\sqrt{8}=2.83. CV=\frac{2.83}{10}\times100=28.3\%.
Problem. Set P: mean 80, \sigma=8. Set Q: mean 120, \sigma=15. Which is more variable?
Solution. CV_P=\frac{8}{80}\times100=10\%; CV_Q=\frac{15}{120}\times100=12.5\%. Set Q is more variable (less consistent), although only by a little; set P is more consistent.
Chapter summary
- Range =L-S; coefficient \frac{L-S}{L+S}.
- Q_1 at \frac{n+1}{4}th item, Q_3 at \frac{3(n+1)}{4}th item (individual/discrete); \frac{n}{4}, \frac{3n}{4} with the interpolation formula for continuous data.
- QD=\frac{Q_3-Q_1}{2}; coefficient \frac{Q_3-Q_1}{Q_3+Q_1}.
- MD=\frac{\sum f|x-\bar x|}{n}; coefficient \frac{MD}{\bar x}.
- \sigma=\sqrt{\frac{\sum f(x-\bar x)^2}{n}}=\sqrt{\frac{\sum fx^2}{n}-\bar x^2}; step deviation \sigma=h\sqrt{\frac{\sum fd'^2}{n}-\left(\frac{\sum fd'}{n}\right)^2}.
- CV=\frac{\sigma}{\bar x}\times100\%; the smaller CV is the more consistent.
- Adding a constant leaves \sigma unchanged; multiplying by k multiplies \sigma by |k|.
Practice questions
Group A — Multiple choice (1 mark each)
- The range of 4, 9, 13, 20 is [1]a13b16c24d4
- The quartile deviation is [1]aQ_3-Q_1b\frac{Q_3-Q_1}{2}c\frac{Q_3+Q_1}{2}dQ_2
- The variance equals [1]a\sigmab\sqrt{\sigma}c\sigma^2d\frac{\sigma}{\bar x}
- The coefficient of variation is [1]a\frac{\bar x}{\sigma}\times100b\frac{\sigma}{\bar x}\times100c\sigma\times\bar xd\frac{\sigma}{n}
- The standard deviation of 7, 7, 7, 7 is [1]a7b49c0d1
Answers to Group A
1. (b) — 20-4.
2. (b).
3. (c).
4. (b).
5. (c) — no spread.
Group B — Short answer (2 marks each)
- Find the range and coefficient of range of 8, 12, 20, 24, 32. [2]
- If Q_1=15 and Q_3=35 find QD and its coefficient. [2]
- Find the mean deviation of 4, 6, 8, 10, 12. [2]
- For a set of data \bar x=40 and \sigma=6. Find the coefficient of variation. [2]
Answers to Group B
1. R=32-8=24; coefficient =\frac{24}{40}=0.6.
2. QD=\frac{20}{2}=10; coefficient =\frac{20}{50}=0.4.
3. Mean 8; deviations 4,2,0,2,4; MD=\frac{12}{5}=2.4.
4. CV=\frac{6}{40}\times100=15\%.
Group C — Short answer (3 marks each)
- Find QD of 12, 15, 18, 20, 25, 28, 30. [3]
- Find the standard deviation of 2, 4, 4, 4, 5, 5, 7, 9. [3]
- For 10 observations \sum x=50 and \sum x^2=300. Find the variance and \sigma. [3]
- Team A: mean 50, \sigma=5; team B: mean 40, \sigma=6. Which is more consistent? [3]
Answers to Group C
1. Q_1=15, Q_3=28; QD=6.5.
2. \sigma=2.
3. Mean 5, variance 30-25=5, \sigma=\sqrt{5}\approx2.24.
4. CV_A=10\%<CV_B=15\%: team A.
Group D — Long answer (4 marks each)
- Find QD and its coefficient for the classes 0–10, 10–20, 20–30, 30–40, 40–50 with frequencies 5, 10, 15, 12, 8. [4]
- Find the standard deviation of the classes 0–10, 10–20, 20–30, 30–40, 40–50 with frequencies 1, 2, 8, 14, 15. [4]
- Find the mean deviation and its coefficient for x=10,20,30,40,50 with f=1,1,7,5,6. [4]
- Ram's marks have mean 60 and \sigma=9; Sita's have mean 75 and \sigma=9. Find the CV of each and state who is more consistent. [4]
Answers to Group D
1. Q_1=17.5, Q_3=36.25, QD=9.375, coefficient \approx0.349.
2. \bar x=35, \sigma=10 (variance 100).
3. \bar x=37; \sum f|x-\bar x|=186; MD=9.3; coefficient =0.251.
4. CV=15\% (Ram) and 12\% (Sita): Sita is more consistent.
Practise more: Mathematics question bank