Unit 18 · Programming · 32 min read
Program Design Tools
What the syllabus asks for 5
- Program and programming; steps of program development
- Algorithm: meaning, features and writing algorithms
- Flowchart: symbols, rules and drawing flowcharts
- Sequence, selection and repetition in algorithms and flowcharts
- Pseudocode
A computer does exactly what it is told, in exactly the order it is told, and nothing else. It cannot guess what you meant. So before anyone writes a program, they plan the solution on paper: what goes in, what must be worked out, what comes out, and in which order. This lesson teaches the three planning tools every programmer uses — the algorithm, the flowchart and pseudocode — and the three patterns from which every plan is built: sequence, selection and repetition. Lessons 19 and 20 then turn these plans into real programs in QBASIC, and grade 9 does the same in Python.
Expect definitions (program, programming, algorithm, flowchart, pseudocode, debugging), the steps of program development as a list or a long answer, the features of a good algorithm, the flowchart symbols drawn and named, and two-point differences (algorithm and flowchart, flowchart and pseudocode). Almost every paper has a 4-mark question that says "Write an algorithm and draw a flowchart to …" — area, simple interest, greater of two numbers, odd or even, sum of numbers, multiplication table or factorial. That question is usually marked 2 + 2: the algorithm and the flowchart must match each other step for step.
18.1 Program and programming; steps of program development
A program is a set of instructions, written in a programming language, that tells a computer how to do a particular task. Programming is the whole process of planning, writing, testing and correcting such programs. A programmer is the person who does it. A group of programs together with their documentation is called software.
The calculator on your phone, the eSewa and Khalti apps, the game you play and the operating system that runs them are all programs. Each one was planned before it was written, in the same way that a house in Bhaktapur is drawn as a naksa (building plan) and approved before a single brick is laid. Planning first is cheaper: a mistake found on paper costs a pencil line, while a mistake found after the program is in use can cost a bank or a school real money.
The steps of program development
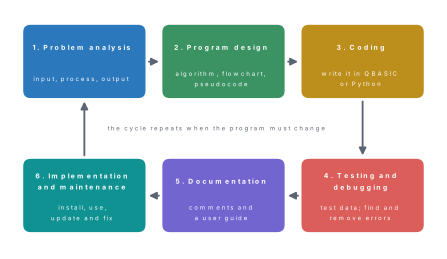
Writing a program is done in a fixed order of steps, called the program development life cycle (PDLC). Different books number them a little differently; the six below cover everything they include.
- Problem analysis. Understand the problem completely before trying to solve it. Find out what input the program will receive, what output it must give, and what processing turns one into the other. Many programmers write this as an IPO chart (Input–Process–Output).
- Program design. Plan the solution step by step, using the design tools of this lesson: an algorithm, a flowchart or pseudocode. A good design is independent of any programming language.
- Coding. Write the design as a program in a programming language such as QBASIC, Python or C. The program as typed by the programmer is called the source code.
- Testing and debugging. Run the program with test data whose correct answers are already known, and compare. An error in a program is called a bug; finding and removing it is debugging. (Lesson 19 explains the three kinds of error.)
- Documentation. Write explanations: comments inside the program, and a user guide that tells people how to install and use it. Good documentation lets another programmer — or you, a year later — understand and change the program.
- Implementation and maintenance. Install the program where it will be used, train the users, and keep it working: fix bugs that appear later, and update it when rules change. A billing program must be changed when the VAT rate changes, and a school result program when the grading system changes.
Problem. A shop in Butwal adds 13% VAT to the price of every item. Analyse the problem "find the VAT and the total amount to pay for an item" by writing its input, process and output. Then check the plan with a price of Rs 2,500.
Solution.
| Input | Process | Output |
|---|---|---|
| price of the item, P | VAT = P × 13 ÷ 100; Total = P + VAT | VAT and Total |
Check with test data. P = 2,500: VAT = 2,500 × 13 ÷ 100 = Rs 325; Total = 2,500 + 325 = Rs 2,825. When the program is written later, it must print exactly these two numbers for this input; if it does not, it has a bug.
Analyse, Design, Code, Test, Document, Maintain. In a long answer write each step as a heading followed by two sentences: what is done, and why it matters. Four well-explained steps earn more than six bare names.
18.2 Algorithm: meaning, features and writing algorithms
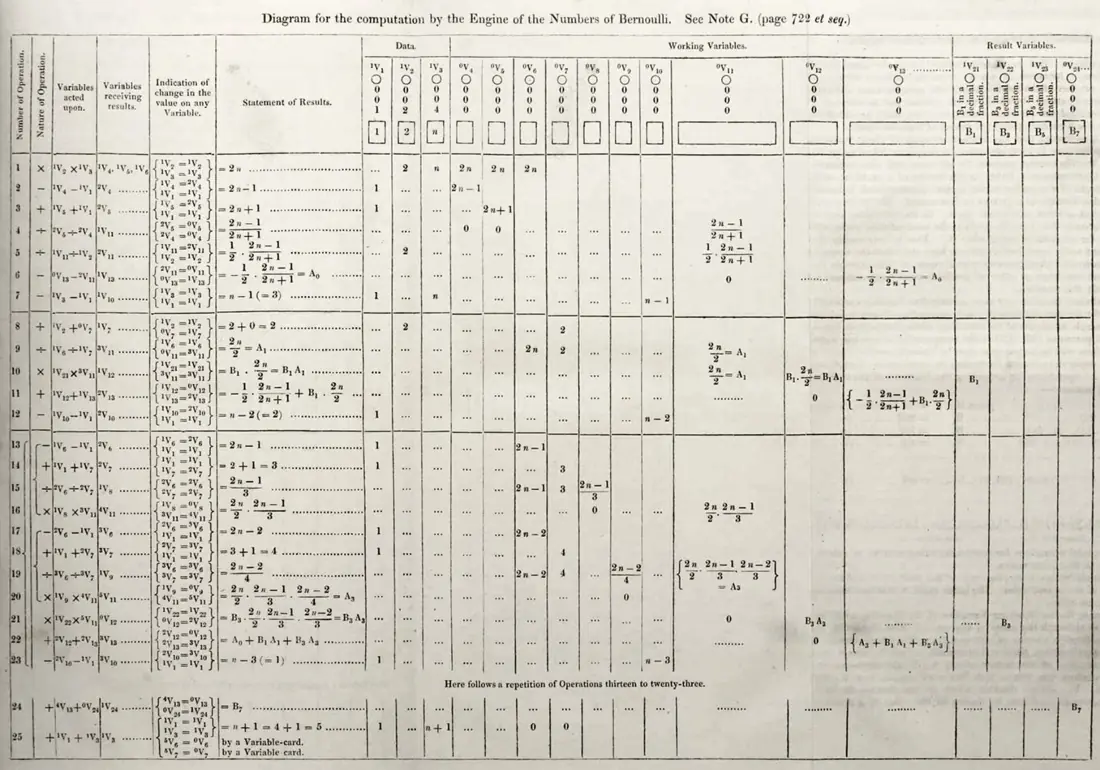
An algorithm is a finite set of clear, step-by-step instructions, written in simple language, for solving a problem. It begins with Start, ends with Stop, and gives the same correct result every time it is followed with the same input.
The word comes from the name of Muhammad ibn Musa al-Khwarizmi, a Persian mathematician of the ninth century who worked in Baghdad. When his book on Hindu–Arabic numerals was translated into Latin, his name was written Algoritmi, and step-by-step methods of calculation came to be called after him.
You follow algorithms every day without calling them that. Here is one for making a cup of milk tea:
- Start.
- Pour one cup of water and half a cup of milk into a pan.
- Heat the pan until the mixture boils.
- Add one spoon of tea leaves and two spoons of sugar.
- Boil for two more minutes.
- Strain the tea into a cup.
- Stop.
Notice that every step is a single, clear action, the order matters (you cannot strain the tea before boiling it), and the list comes to an end.
Features of a good algorithm
| Feature | Meaning | What goes wrong without it |
|---|---|---|
| Input | It accepts zero or more clearly stated inputs. | The user does not know what to type. |
| Output | It produces at least one result. | The work is done but nobody sees it. |
| Definiteness | Every step is clear and has only one meaning. | "Add some sugar" — how much? |
| Finiteness | It ends after a limited number of steps. | The steps repeat for ever (an infinite loop). |
| Effectiveness | Every step is simple enough to be carried out exactly. | "Find the answer" is not a step anyone can do. |
| Language independence | It can be turned into any programming language. | A plan that only works in one language is a program, not an algorithm. |
Advantages of algorithms. They are written in ordinary language, so they are easy to write and to understand; they are independent of any programming language; and they let a programmer find mistakes in the logic before any code is typed. Disadvantages. A long algorithm for a big problem is tiring to read, and branches and loops are harder to follow in words than in a picture — which is why flowcharts are used beside them.
Writing an algorithm
Number the steps. Begin with Start and end with Stop. Use the same few action words every time: Read (or Input) for input, Calculate or a formula for processing, Display (or Print) for output, If … then … else for decisions, and Go to step n or Repeat for loops. Give every value a short name — a variable such as P, T, R or SUM — and use the same name all the way through.
Problem. Write an algorithm to find the sum and the average of the marks a student got in three subjects. Test it with 72, 85 and 90.
Solution.
Step 1: Start. Step 2: Read the three marks A, B and C. Step 3: Calculate SUM = A + B + C. Step 4: Calculate AVG = SUM ÷ 3. Step 5: Display SUM and AVG. Step 6: Stop.
Test. A = 72, B = 85, C = 90: SUM = 72 + 85 + 90 = 247; AVG = 247 ÷ 3 = 82.33 (to two decimal places).
"Calculate the answer" is not a step
Students often write steps like "Step 3: Calculate the result" or "Step 3: Find the area". A marker gives no mark for these, because the step does not say how. Write the formula itself: "Step 3: A = L × B". The same goes for input and output: name the variables you read and the ones you display.
18.3 Flowchart: symbols, rules and drawing flowcharts
A flowchart is a pictorial representation of an algorithm. It shows each step in a standard symbol and joins the symbols with arrows, called flow lines, that show the order in which the steps are carried out.
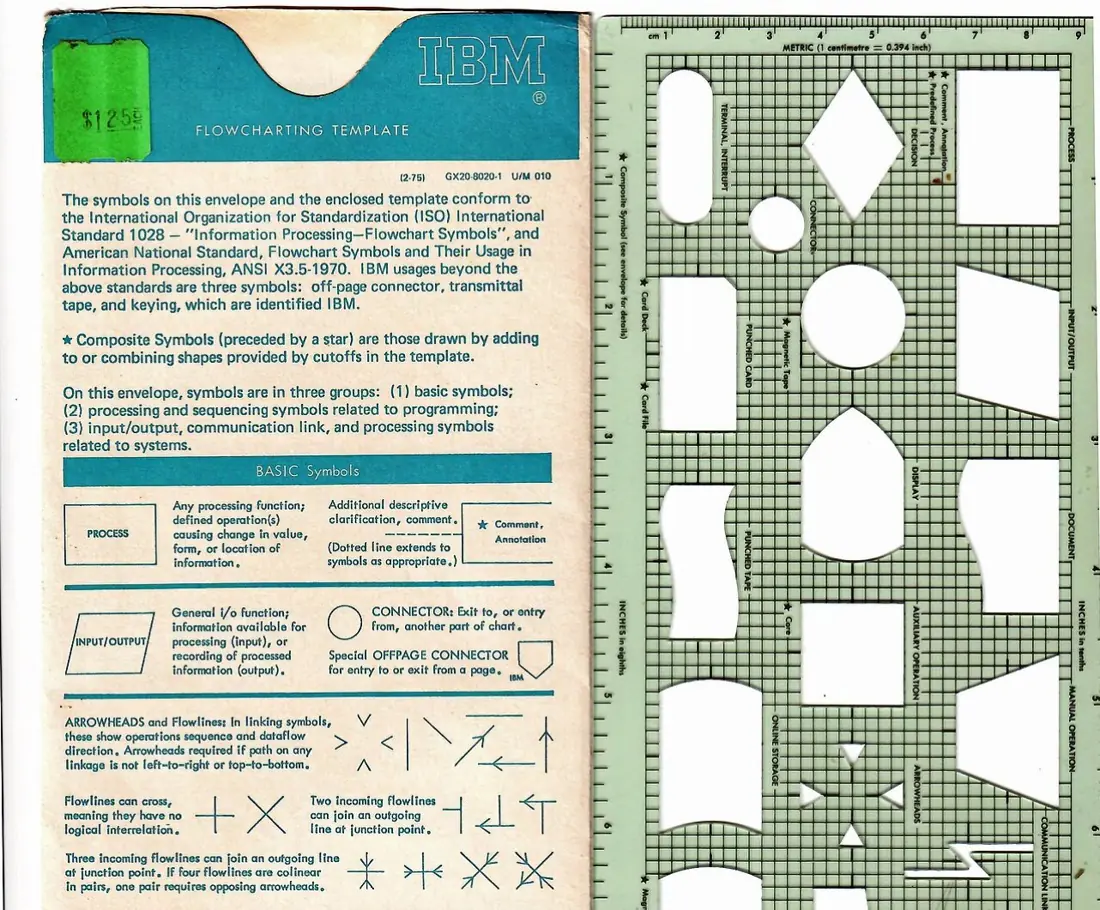
Flowcharts are older than computers. The engineers Frank and Lillian Gilbreth drew "flow process charts" of factory work in 1921, and in 1947 Herman Goldstine and John von Neumann used flow diagrams to plan programs for one of the first electronic computers. The symbols were later fixed by standards (ANSI in 1970, then ISO 5807 in 1985), so a flowchart drawn in Kathmandu means the same thing to a programmer anywhere in the world.
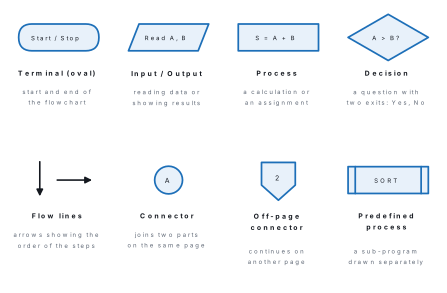
| Symbol | Name | Used for | Example inside it |
|---|---|---|---|
| oval (rounded rectangle) | terminal | start and stop | Start, Stop |
| parallelogram | input/output | reading input and displaying output | Read P, T, R; Print SI |
| rectangle | process | calculation, assignment | SI = P × T × R ÷ 100 |
| diamond | decision | a yes/no question | Is A > B? |
| arrow | flow line | the direction of flow | — |
| small circle | connector | joining two parts on the same page | A |
Rules for drawing a flowchart
- A flowchart has one Start and (normally) one Stop terminal.
- Use only the standard symbols, each for its own job.
- The flow goes from top to bottom and from left to right; every flow line has an arrowhead.
- A process or input/output symbol has one entry and one exit. A decision symbol has one entry and two exits, labelled Yes and No (or True and False).
- Flow lines should not cross. If a flowchart is too big, use connectors instead of long lines.
- Write short, clear statements inside the symbols, using the same variable names as the algorithm.
- Every path through the flowchart must lead to Stop.
| Advantages of a flowchart | Disadvantages of a flowchart |
|---|---|
| the logic is easy to see at a glance | a complicated program gives a huge, messy flowchart |
| a good way to explain a plan to others | a small change may mean redrawing the whole chart |
| mistakes in the logic are easy to spot | drawing takes more time than writing steps |
| it serves as documentation of the program | it cannot be run on a computer |
| Algorithm | Flowchart |
|---|---|
| step-by-step solution written in words | step-by-step solution drawn with symbols |
| numbered steps (Step 1, Step 2, …) | shapes joined by arrows |
| easy to write and to change | easy to understand at a glance, but slower to draw |
| branches and loops are harder to follow | branches and loops are easy to see |
| needs no special symbols | needs standard symbols |
18.4 Sequence, selection and repetition in algorithms and flowcharts
In 1966 two Italian computer scientists, Corrado Böhm and Giuseppe Jacopini, showed that every algorithm can be built from only three patterns, called control structures. Learn to recognise them, because every exam algorithm is made of them.
| Structure | What happens | Flowchart shape | Everyday example |
|---|---|---|---|
| Sequence | steps are done one after another, each exactly once | a straight column of boxes | following a recipe |
| Selection (decision, branching) | a condition is tested and one of two paths is taken | a diamond with Yes and No exits | if it rains, take an umbrella, else wear a cap |
| Repetition (iteration, loop) | a group of steps is repeated while a condition is true | an arrow that goes back up to a decision | keep stirring until the sugar dissolves |
Sequence
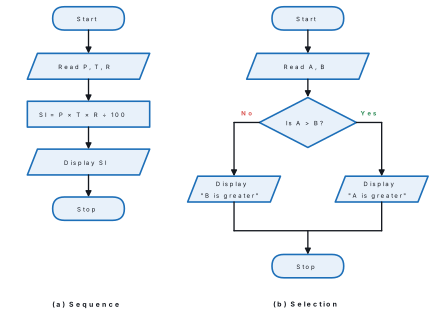
Problem. Write an algorithm and draw a flowchart to find the simple interest on a principal P for time T years at R% per year. Test it with P = Rs 50,000, T = 2 years and R = 8%.
Solution.
Step 1: Start. Step 2: Read P, T and R. Step 3: Calculate SI = P × T × R ÷ 100. Step 4: Display SI. Step 5: Stop.
The flowchart is part (a) of the figure below: one terminal, one input, one process, one output, one terminal, in a straight line.
Test. SI = 50,000 × 2 × 8 ÷ 100 = Rs 8,000.
Each step of the algorithm becomes one line of the program; grade 9 teaches this language.
p = float(input("Principal (Rs): "))
t = float(input("Time (years): "))
r = float(input("Rate (% per year): "))
si = p * t * r / 100
print("Simple interest = Rs", si)
Principal (Rs): 50000
Time (years): 2
Rate (% per year): 8
Simple interest = Rs 8000.0
Selection
Problem. Write an algorithm and draw a flowchart to display the greater of two numbers.
Solution.
Step 1: Start. Step 2: Read two numbers A and B. Step 3: Is A > B? If yes, display "A is greater" and go to step 5. Step 4: Otherwise, display "B is greater". Step 5: Stop.
This is part (b) of the figure below. The decision box has exactly two exits, labelled Yes and No, and the two paths meet again before Stop.
a = int(input("First number: "))
b = int(input("Second number: "))
if a > b:
    print(a, "is greater")
else:
    print(b, "is greater")
First number: 45
Second number: 72
72 is greater
A decision can test any condition that is either true or false. The comparison signs used in algorithms are > (greater than), < (less than), = (equal to), ≥ (greater than or equal to), ≤ (less than or equal to) and ≠ (not equal to). To test whether a number is even, divide it by 2 and look at the remainder: the remainder is 0 for an even number and 1 for an odd one. Most programming languages call the remainder operation MOD, so "N MOD 2 = 0" means "N is even".
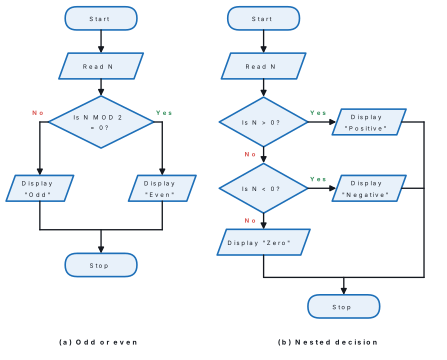
A decision can also lead to another decision. This is called a nested decision, and it is how a plan chooses among three or more possibilities.
Problem. (a) Write an algorithm to test whether a number is even or odd. (b) Write an algorithm to say whether a number is positive, negative or zero. Draw both flowcharts.
Solution. (a) Step 1: Start. Step 2: Read N. Step 3: Is N MOD 2 = 0? If yes, display "Even"; otherwise display "Odd". Step 4: Stop.
(b) Step 1: Start. Step 2: Read N. Step 3: Is N > 0? If yes, display "Positive" and go to step 5. Step 4: Is N < 0? If yes, display "Negative"; otherwise display "Zero". Step 5: Stop.
Test (b). N = −7: the first test (−7 > 0) is false, the second (−7 < 0) is true, so the output is Negative. N = 0 fails both tests and gives Zero. Three different test values are needed to try all three paths.
Repetition
A loop repeats a group of steps. Every loop has the same three parts, and leaving out any one of them is a classic error:
- Initialisation — give the loop variables their starting values before the loop (I = 1, SUM = 0).
- Condition — a test, checked every time round, that decides whether to repeat (Is I ≤ N?).
- Update — a step inside the loop that changes the loop variable, so that the condition eventually becomes false (I = I + 1).
A variable such as I that counts the repetitions is called a counter. A variable such as SUM that collects a running total is called an accumulator.
Problem. Write an algorithm and draw a flowchart to find 1 + 2 + 3 + … + N. Trace it for N = 5.
Solution.
Step 1: Start. Step 2: Read N. Step 3: Set I = 1 and SUM = 0. Step 4: Is I ≤ N? If no, go to step 7. Step 5: SUM = SUM + I. Step 6: I = I + 1, and go to step 4. Step 7: Display SUM. Step 8: Stop.
A trace table (dry run) follows the algorithm by hand and writes down every value, exactly as the computer would:
| Pass | I at the test | I ≤ 5? | SUM after step 5 | I after step 6 |
|---|---|---|---|---|
| 1 | 1 | Yes | 0 + 1 = 1 | 2 |
| 2 | 2 | Yes | 1 + 2 = 3 | 3 |
| 3 | 3 | Yes | 3 + 3 = 6 | 4 |
| 4 | 4 | Yes | 6 + 4 = 10 | 5 |
| 5 | 5 | Yes | 10 + 5 = 15 | 6 |
| — | 6 | No | — | — |
The loop stops when I becomes 6, and the output is SUM = 15. Check: 1 + 2 + 3 + 4 + 5 = 15 ✓. For N = 10 the same algorithm gives 55, which agrees with the shortcut N × (N + 1) ÷ 2 = 10 × 11 ÷ 2 = 55.
n = int(input("Enter N: "))
i = 1
total = 0
while i <= n:
    total = total + i
    i = i + 1
print("Sum =", total)
Enter N: 10
Sum = 55
Problem. Write an algorithm and draw a flowchart to display the multiplication table of a number N, from N × 1 to N × 10.
Solution.
Step 1: Start. Step 2: Read N. Step 3: Set I = 1. Step 4: Is I ≤ 10? If no, go to step 7. Step 5: Display N, "×", I, "=", N × I. Step 6: I = I + 1, and go to step 4. Step 7: Stop.
For N = 6 the output runs 6 × 1 = 6, 6 × 2 = 12, …, 6 × 10 = 60: ten lines, because the loop body runs for I = 1, 2, …, 10 and the test fails when I reaches 11.
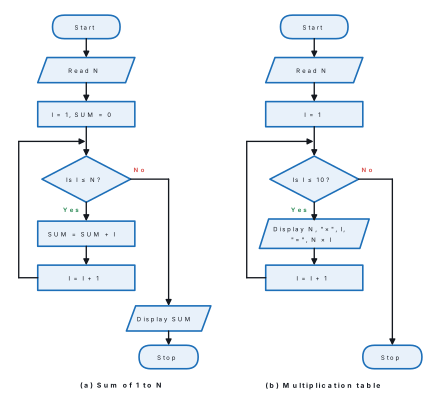
If the update step "I = I + 1" is left out, I stays at 1 for ever, the test "Is I ≤ N?" is always true, and the loop never ends. This is an infinite loop, and it breaks the finiteness rule of an algorithm. The same happens if the loop line goes back to the initialisation box instead of to the decision, because I is reset to 1 every time. In a flowchart, the arrow from the end of the loop body must return to the point just above the decision, below the initialisation.
18.5 Pseudocode
Pseudocode ("false code") is a way of writing an algorithm in short, structured English statements that look like a programming language but follow no strict rules of any one language. It cannot be run on a computer, but it is very easy to turn into a real program.
Pseudocode sits between an algorithm and a program. An algorithm is written in sentences; a program must obey the exact grammar (syntax) of its language; pseudocode uses a small set of keywords in capital letters and indentation to show which statements belong inside a decision or a loop.
| Purpose | Pseudocode keywords |
|---|---|
| start and end | BEGIN … END |
| input and output | INPUT (or READ), PRINT (or DISPLAY, OUTPUT) |
| assignment | SET, or an arrow: SUM ← SUM + I, or simply SUM = SUM + I |
| selection | IF … THEN … ELSE … ENDIF |
| repetition | WHILE … ENDWHILE; FOR … TO … NEXT; REPEAT … UNTIL |
Rules. Write one statement on each line. Put keywords in capitals. Indent the statements inside IF, WHILE and FOR, and close every block with its matching END word. Use meaningful variable names, and keep the pseudocode free of the special punctuation of any one language.
Problem. Write pseudocode for (a) the greater of two numbers and (b) the sum of the first N natural numbers.
Solution.
(a)  BEGIN
         INPUT A, B
         IF A > B THEN
             PRINT "A is greater"
         ELSE
             PRINT "B is greater"
         ENDIF
     END

(b)  BEGIN
         INPUT N
         SET I = 1
         SET SUM = 0
         WHILE I <= N
             SUM = SUM + I
             I = I + 1
         ENDWHILE
         PRINT SUM
     END
Compare (b) with the Python program in section 18.4: the two are almost line for line the same. That closeness is the whole point of pseudocode.
Worked example 18.9 — factorial, from pseudocode to a checked answer
Problem. The factorial of N, written N!, is 1 × 2 × 3 × … × N. Write pseudocode to find it and trace it for N = 5.
Solution.
BEGIN
    INPUT N
    SET F = 1
    FOR I = 1 TO N
        F = F × I
    NEXT I
    PRINT F
END
Trace for N = 5: F becomes 1 × 1 = 1, then 1 × 2 = 2, 2 × 3 = 6, 6 × 4 = 24 and 24 × 5 = 120. F starts at 1, not 0: if it started at 0, every product would be 0.
n = int(input("Enter a number: "))
f = 1
i = 1
while i <= n:
    f = f * i
    i = i + 1
print("Factorial of", n, "is", f)
Enter a number: 5
Factorial of 5 is 120
| Point | Algorithm | Flowchart | Pseudocode |
|---|---|---|---|
| Form | numbered steps in plain language | standard symbols joined by arrows | structured English with keywords |
| Easy to write | yes | slowest to draw | yes |
| Easy to follow branches and loops | hard in long algorithms | easiest | easy, thanks to indentation |
| Closeness to a real program | far | far | very close |
| Changing it | easy | may need redrawing | easy |
In a "write an algorithm and draw a flowchart" question, use the same variable names (P, T, R, SI) in both, keep one symbol for each step, label both exits of every diamond, and make every arrow point. Add a line of test data at the end — "for P = 50,000, T = 2, R = 8, SI = 8,000" — to show the marker your plan works.
Work in pairs. Each of you writes an algorithm for an everyday job — crossing the road at a zebra crossing, withdrawing cash from an ATM, or sending a photo on Viber — with at least one decision. Swap papers and follow your partner's steps exactly as written, saying each action aloud, and stop wherever a step is unclear or two meanings are possible. Then draw the flowchart of the corrected algorithm, on paper or in the free tool draw.io (diagrams.net), and turn one of the algorithms of this lesson into pseudocode.
Chapter summary
- A program is a set of instructions in a programming language; programming is planning, writing, testing and correcting programs.
- The program development life cycle: problem analysis (input, process, output), program design, coding, testing and debugging, documentation, implementation and maintenance.
- An algorithm is a finite set of clear step-by-step instructions from Start to Stop; a good one has input, output, definiteness, finiteness and effectiveness.
- A flowchart draws an algorithm with standard symbols: oval (start/stop), parallelogram (input/output), rectangle (process), diamond (decision), arrows (flow lines), circle (connector).
- Flowchart rules: one Start and one Stop, top to bottom, arrows on every line, two labelled exits on every decision, no crossing lines.
- Every algorithm is built from sequence, selection (decision, branching) and repetition (loop); a loop needs initialisation, a condition and an update, or it never ends.
- Pseudocode is structured English with keywords (INPUT, PRINT, IF … ENDIF, WHILE … ENDWHILE, FOR … NEXT) that is easy to turn into a real program.
- A trace table (dry run) follows an algorithm by hand to test it before coding.
Practice questions
Group A — Objective (1 mark each)
- A finite set of step-by-step instructions for solving a problem is called [1]aa flowchartban algorithmca compilerda bug
- Which flowchart symbol is used for a decision? [1]arectanglebparallelogramcdiamonddoval
- Which flowchart symbol is used for "Read N" or "Print SUM"? [1]aparallelogrambrectangleccircleddiamond
- The feature that an algorithm must end after a limited number of steps is [1]adefinitenessbfinitenessceffectivenessdoutput
- Which is the first step of program development? [1]acodingbtestingcproblem analysisddocumentation
- A small circle in a flowchart is a [1]aterminalbconnectorcdecisiondprocess
- Structured English statements such as IF … THEN … ENDIF that cannot be run on a computer are called [1]amachine codebpseudocodecsource codedobject code
- Finding and removing errors from a program is called [1]acodingbdebuggingcdocumentationdmaintenance
- "Keep stirring until the sugar dissolves" is an example of [1]asequencebselectioncrepetitionddocumentation
- An algorithm sets S = 0, then adds I to S for I = 1, 2, 3 and 4, then displays S. The output is [1]a4b6c10d24
- How many exits does a decision symbol have? [1]aonebtwocthreedfour
- Which of these can be run directly on a computer? [1]aan algorithmba flowchartcpseudocodeda program
Answers to Group A
1. (b) — that is the definition of an algorithm.
2. (c) — the diamond holds a yes/no question.
3. (a) — input and output use the parallelogram.
4. (b) — finiteness means the steps come to an end.
5. (c) — the problem must be understood before it is designed or coded.
6. (b) — a connector joins two parts of a flowchart on the same page.
7. (b) — pseudocode means "false code".
8. (b) — an error is a bug, and removing it is debugging.
9. (c) — the action is repeated until a condition becomes true.
10. (c) — 0 + 1 + 2 + 3 + 4 = 10.
11. (b) — Yes and No.
12. (d) — algorithms, flowcharts and pseudocode are plans; only a program runs.
Group B — Short answer (2 marks each)
- Define program and programming. [2]
- What is an algorithm? Write any two features of a good algorithm. [2]
- Draw the symbols for terminal, input/output, process and decision, and write the use of each. [2]
- Write any two differences between an algorithm and a flowchart. [2]
- What is pseudocode? Write one advantage of it. [2]
- Write an algorithm to find the area of a rectangle. [2]
- Write an algorithm to convert a temperature in degrees Celsius into degrees Fahrenheit. Test it with 37 °C. [2]
- What is selection? Give one example from daily life. [2]
- Define debugging and documentation. [2]
- What is a loop? What is an infinite loop? [2]
Answers to Group B
1. A program is a set of instructions, written in a programming language, that tells a computer how to do a task. Programming is the process of planning, writing, testing and correcting programs.
2. An algorithm is a finite set of clear, step-by-step instructions for solving a problem, from Start to Stop. Any two features: it has input and output; every step is definite (one meaning only); it is finite (it ends); every step is effective (can be carried out).
3. Terminal — an oval, used for Start and Stop. Input/output — a parallelogram, used to read data or display results. Process — a rectangle, used for a calculation or assignment. Decision — a diamond, used for a yes/no question with two exits.
4. An algorithm is written in words as numbered steps, while a flowchart is drawn with standard symbols joined by arrows. An algorithm is quicker to write and change, while a flowchart is easier to follow, especially for branches and loops.
5. Pseudocode is a way of writing an algorithm in structured English statements with keywords such as INPUT, PRINT, IF … ENDIF and WHILE … ENDWHILE. Advantage: it is very close to a real program, so it is easy to convert into code (it also needs no drawing).
6. Step 1: Start. Step 2: Read the length L and breadth B. Step 3: A = L × B. Step 4: Display A. Step 5: Stop.
7. Step 1: Start. Step 2: Read C. Step 3: F = C × 9 ÷ 5 + 32. Step 4: Display F. Step 5: Stop. Test: F = 37 × 9 ÷ 5 + 32 = 66.6 + 32 = 98.6 °F.
8. Selection is a control structure in which a condition is tested and one of two (or more) paths is followed depending on whether it is true or false. Example: if the traffic light is green, cross the road; otherwise wait.
9. Debugging is finding and removing the errors (bugs) in a program. Documentation is writing explanations of a program — comments in the code and a user guide — so that others can understand, use and change it.
10. A loop is a group of steps that is repeated while a condition is true (or a fixed number of times). An infinite loop is a loop whose condition never becomes false, usually because the update step is missing, so it repeats for ever.
Group C — Long answer (4 marks each)
- Explain the steps of program development. [4]
- Write an algorithm and draw a flowchart to find the area and circumference of a circle of radius R. [2+2]
- Write an algorithm and draw a flowchart to check whether a person is eligible to vote in Nepal (age 18 years or more). [2+2]
- Write an algorithm and draw a flowchart to find the factorial of a number. Trace it for N = 4. [2+2]
- What is a flowchart? Write any four rules for drawing a flowchart and any two of its advantages. [1+2+1]
Answers to Group C
1. (i) Problem analysis: understand the problem and list its input, process and output. (ii) Program design: plan the solution step by step with an algorithm, flowchart or pseudocode. (iii) Coding: write the plan in a programming language such as QBASIC or Python. (iv) Testing and debugging: run the program with test data whose answers are known, and find and remove errors. (v) Documentation: write comments and a user guide. (vi) Implementation and maintenance: install the program, train users, and fix and update it later. (Four steps well explained earn full marks.)
2. Algorithm. Step 1: Start. Step 2: Read R. Step 3: A = 3.14 × R × R. Step 4: C = 2 × 3.14 × R. Step 5: Display A and C. Step 6: Stop. Flowchart. Start (oval) → Read R (parallelogram) → A = 3.14 × R × R (rectangle) → C = 2 × 3.14 × R (rectangle) → Display A, C (parallelogram) → Stop (oval), joined top to bottom by arrows. Test: R = 7 gives A = 153.86 and C = 43.96.
3. Algorithm. Step 1: Start. Step 2: Read AGE. Step 3: Is AGE ≥ 18? If yes, display "Eligible to vote"; otherwise display "Not eligible". Step 4: Stop. Flowchart. Start → Read AGE (parallelogram) → diamond "Is AGE ≥ 18?" → Yes exit to a parallelogram "Display Eligible to vote"; No exit to a parallelogram "Display Not eligible" → both paths join → Stop. Test: AGE = 20 gives Eligible; AGE = 16 gives Not eligible.
4. Algorithm. Step 1: Start. Step 2: Read N. Step 3: Set F = 1 and I = 1. Step 4: Is I ≤ N? If no, go to step 7. Step 5: F = F × I. Step 6: I = I + 1, and go to step 4. Step 7: Display F. Step 8: Stop. Flowchart. Start → Read N → rectangle "F = 1, I = 1" → diamond "Is I ≤ N?" → Yes: rectangle "F = F × I" → rectangle "I = I + 1" → arrow back up to just above the diamond; No: parallelogram "Display F" → Stop. Trace for N = 4: I = 1, F = 1; I = 2, F = 2; I = 3, F = 6; I = 4, F = 24; I = 5 fails the test, so the output is 24.
5. A flowchart is a pictorial representation of an algorithm using standard symbols joined by flow lines (1 mark). Any four rules: one Start and one Stop; use standard symbols only; flow from top to bottom and left to right with an arrowhead on every line; a decision has two labelled exits (Yes/No); flow lines do not cross — use connectors; write short statements inside the symbols (2 marks). Any two advantages: the logic is easy to understand; mistakes are easy to find; it helps explain the plan to others; it documents the program (1 mark).
Practise more: Computer Science question bank