Unit 21 · Compulsory Mathematics · 14 min read
Statistics
What the syllabus asks for 4
- collection and tabulation of data
- bar graph and pie chart
- mean, median and mode of individual series
- interpretation of statistical data
Statistics is how a large number of facts is turned into a few sentences. Two hundred marks become one average; a week of temperature readings become a line on a graph; fifty households become a pie chart. This chapter covers the three averages — mean, median and mode — and the two pictures, the bar graph and the pie chart, that a reader can take in at a glance.
You should be able to collect, tally and tabulate data, draw and read a bar graph, draw a pie chart by converting frequencies into angles, and find the mean, the median and the mode of an individual series and say when each is the most useful average.
21.1 Collecting and tabulating data
Data are facts or numbers collected for a purpose. Statistics is the science of collecting, organising, presenting and interpreting them.
Method.
- Decide exactly what you want to find out and write the question down.
- Collect the data — by counting, measuring, asking, or reading a record.
- Tally it as you go, in groups of five.
- Make a frequency table with a total row, and check the total against the number of observations.
- Present it as a table, a bar graph or a pie chart.
- Interpret: say in words what the table shows.
| Marks | Tally | Frequency |
|---|---|---|
| 0–20 | II | 2 |
| 20–40 | IIII I | 6 |
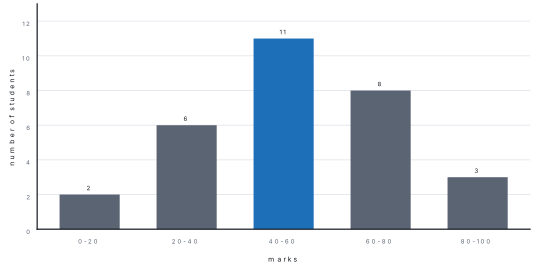
| 40–60 | IIII IIII I | 11 |
| 60–80 | IIII III | 8 |
| 80–100 | III | 3 |
| Total | 30 |
Before doing anything with a frequency table, add the frequencies and compare with the number of observations. A total that does not match means a miscount, and every average and every angle calculated from it will be wrong. In the table above, 2+6+11+8+3=30 ✓.
21.2 Pictographs, bar graphs and pie charts
21.2.1 Bar graph
A bar graph shows the frequency of each value or class as a bar whose height is proportional to the frequency. Bars are of equal width and are separated by equal gaps.
21.2.2 Pie chart
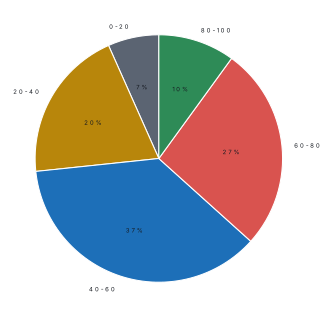
A pie chart shows each frequency as a slice of a circle. The whole circle is 360°, so the angle of a slice is
Problem. In a class of 40 students, 12 come on foot, 10 by bicycle, 14 by bus and 4 by other means. Draw a pie chart.
Solution. Total =40, so each student is \frac{360}{40}=9°.
| Means | Frequency | Angle |
|---|---|---|
| On foot | 12 | 12\times9=108° |
| Bicycle | 10 | 10\times9=90° |
| Bus | 14 | 14\times9=126° |
| Other | 4 | 4\times9=36° |
| Total | 40 | 360° |
Draw a circle, mark a radius, and lay off the angles in order with a protractor.
Answer. As in the table.
Check. 108+90+126+36=360 ✓ — the angles of a pie chart must close the circle exactly. A total that is not 360° means an arithmetic slip somewhere.
Problem. A pie chart shows household spending: food 144°, rent 90°, school 72°, and the rest as savings. If the monthly income is Rs 20,000, find the amount spent on food and the amount saved.
Solution. The savings angle is
Food: \frac{144}{360}\times20\,000=\text{Rs }8000.
Savings: \frac{54}{360}\times20\,000=\text{Rs }3000.
Answer. Food Rs 8,000; savings Rs 3,000.
Check. Rent is \frac{90}{360}\times20\,000=\text{Rs }5000 and school is \frac{72}{360}\times20\,000=\text{Rs }4000; the four amounts add to 8000+5000+4000+3000=\text{Rs }20\,000 ✓.
21.3 Mean, median and mode
For an individual series — a plain list of values, without frequencies:
| Average | Definition | How to find it |
|---|---|---|
| Mean | the sum of all the values divided by how many there are | \bar x=\frac{\sum x}{n} |
| Median | the middle value when the values are arranged in order | odd n: the \frac{n+1}{2}th value; even n: the mean of the two middle values |
| Mode | the value that occurs most often | count the repeats |
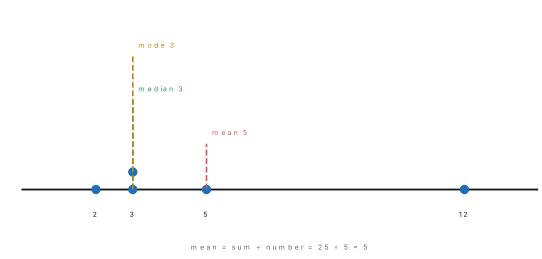
Problem. Find the mean, median and mode of the data 2, 3, 3, 5, 12.
Solution. Mean. \bar x=\frac{2+3+3+5+12}{5}=\frac{25}{5}=5.
Median. Arrange in order (already ordered): 2, 3, 3, 5, 12. With n=5 the median is the \frac{5+1}{2}=3rd value, which is 3.
Mode. The value that appears most often is 3 (twice).
Answer. Mean 5, median 3, mode 3.
What it shows. Four of the five values are 5 or less, and yet the mean is 5 because the single value 12 pulls it up. The median is not affected by how large the largest value is — which is why house prices and salaries are usually reported as medians. This is the meaning of an outlier.
Problem. Find the median of 8, 4, 6, 10, 3, 7.
Solution. Arrange in order: 3, 4, 6, 7, 8, 10. With n=6 (even) the median is the mean of the 3rd and 4th values:
Answer. 6.5.
Check. Three values lie below 6.5 and three above ✓. Note that the median need not be one of the data values.
Problem. The monthly salaries in a small office are Rs 18,000, Rs 18,000, Rs 20,000, Rs 22,000 and Rs 150,000. Which average best describes a typical salary, and why?
Solution. Mean =\frac{18\,000+18\,000+20\,000+22\,000+150\,000}{5} =\frac{228\,000}{5}=\text{Rs }45\,600. Median = Rs 20,000 (the third of five ordered values). Mode = Rs 18,000.
The median is the honest description: four of the five people earn Rs 22,000 or less, and the mean of Rs 45,600 describes nobody, because it has been pulled up by the one very large salary.
Check. The median lies in the middle of the ordered list, with two salaries below and two above ✓.
The mean uses every value, which is usually an advantage — but one extreme value can move it a long way. Whenever a set contains an outlier, report the median as well, and say which one you are using and why.
Problem. Five houses scored 14, 16, 18, a and 17 points in an inter-house volleyball competition. The mean score is 16. Find a.
Solution. \sum X=14+16+18+a+17=65+a and n=5.
80=65+a, so a=15.
Check. \frac{14+16+18+15+17}{5}=\frac{80}{5}=16 ✓.
Problem. The values x, x+2, x+5, x+7, x+8 are in ascending order and their median is 15. Find x.
Solution. n=5 (odd), so the median is the \frac{5+1}{2}=3rd value, which is x+5. So x+5=15 and x=10.
Problem. The weights of 8 students are 45, 39, 52, 50, 41, 48, 60 and 43 kg. Find the median weight.
Solution. In ascending order: 39, 41, 43, 45, 48, 50, 52, 60. n=8 (even), so the median is the mean of the \frac n2=4th and \left(\frac n2+1\right)=5th values: Md=\frac{45+48}{2}=46.5 kg.
21.3.1 A frequency table with classes
When the data are grouped into classes, use the mid-value of each class as the representative value.
| Class | Mid-value m | Frequency f | fm |
|---|---|---|---|
| 0–20 | 10 | 2 | 20 |
| 20–40 | 30 | 6 | 180 |
| 40–60 | 50 | 11 | 550 |
| 60–80 | 70 | 8 | 560 |
| 80–100 | 90 | 3 | 270 |
| Total | 30 | 1580 |
The modal class is the class with the highest frequency — here 40–60 — and for a grouped table that is what "mode" means. (Grouped data are studied fully in Grade 9; in Grade 8 the exam asks for the mean, median and mode of an individual series.)
21.4 Choosing the right average
Mean, median and mode answer different questions. The examiner often asks which average is suitable, and that is a reasoning mark.
| Average | Best when | Weakness |
|---|---|---|
| Mean | the data are evenly spread and every value matters | one extreme value drags it |
| Median | there is an extreme value (income, land size) | ignores the size of the other values |
| Mode | the data are categories (shoe size, favourite subject) | may not exist, or there may be several |
Question. The marks of 50 students are: 0–10: 4, 10–20: 8, 20–30: 14, 30–40: 16, 40–50: 8. Find the mean mark and name the modal class.
Answer. Mid-values: 5, 15, 25, 35, 45. \sum fx = 4(5) + 8(15) + 14(25) + 16(35) + 8(45) = 20 + 120 + 350 + 560 + 360 = 1410. Mean = \frac{1410}{50} = \textbf{28.2 marks}. The highest frequency is 16, so the modal class is 30–40.
Question. In a pie chart of 900 households, the sector for firewood is 140°. How many households use firewood?
Answer. Households = \frac{140}{360} \times 900 = \textbf{350}.
Collect one piece of data from every household in your lane (say, the number of people, or the main cooking fuel). Make a frequency table, find the mean, median and mode where they apply, and draw both a bar chart and a pie chart. Write three sentences on which average describes your data best and why.
Chapter summary
- Data are tallied, tabulated with a total, and then presented as a table, a bar graph or a pie chart.
- On a bar graph the height of the bar reads the frequency; bars have equal width and equal gaps.
- On a pie chart \text{angle}=\frac{\text{frequency}}{\text{total}}\times360°, and the angles must add to exactly 360°.
- \text{mean}=\frac{\sum x}{n}; the median is the middle value of the ordered list; the mode is the most frequent value.
- With an even number of values the median is the mean of the two middle ones.
- For grouped data, use the mid-value of each class for the mean, and speak of the modal class rather than the mode.
- An outlier pulls the mean but not the median; report the median when the data contain an extreme value.
Practice questions
Group A — Objective (1 mark each)
- The mean of 4, 6, 8, 10, 12 is [1]a6b8c10d40
- The mode of 3, 5, 5, 7, 9 is [1]a3b5c7d9
- The median of 7, 3, 9, 5, 11 is [1]a5b7c9d11
- In a pie chart the angle for a frequency of 10 out of a total of 50 is [1]a36°b72°c60°d90°
- The median of 2, 4, 6, 8 is [1]a4b5c6d7
- A value that is much larger or smaller than the rest is called [1]athe modebthe mediancan outlierdthe range
Answers to Group A
1. (b) — 40\div5=8.
2. (b) — 5 appears twice.
3. (b) — in order 3, 5, 7, 9, 11 the middle is 7.
4. (b) — \frac{10}{50}\times360=72°.
5. (b) — \frac{4+6}{2}=5.
6. (c) — an outlier.
Group B — Short answer (2 marks each)
- Find the mean of 12, 15, 18, 20, 25. [2]
- Find the median and the mode of 4, 7, 7, 9, 11, 13. [2]
- A pie chart represents 60 students. One slice has an angle of 90°. How many students does it represent? [2]
- The temperatures for a week were 20°, 22°, 21°, 23°, 25°, 24°, 26°. Find the mean temperature. [2]
Answers to Group B
1. \frac{12+15+18+20+25}{5}=\frac{90}{5}=18.
2. Median: with 6 values, \frac{7+9}{2}=8; mode =7.
3. \frac{90}{360}\times60=15 students.
4. \frac{20+22+21+23+25+24+26}{7}=\frac{161}{7}=23°.
Group C — Long answer (4 marks each)
- The marks of 20 students are: 35, 42, 48, 55, 60, 62, 65, 68, 70, 72, 74, 75, 78, 80, 82, 85, 88, 90, 92, 95. Find the mean and the median, and say why they are close together here. [4]
- A survey of 180 families found 45 with no bicycle, 90 with one, 36 with two and 9 with three. Draw a pie chart, and find the mean number of bicycles per family. [4]
Answers to Group C
1. Mean. The sum is 35+42+48+55+60+62+65+68+70+72+74+75+78+80+82+85+88+90+92+95=1416, so \bar x=\frac{1416}{20}=70.8. Median. With n=20 (even) it is the mean of the 10th and 11th values: \frac{72+74}{2}=73. Why they are close. The values rise steadily with no extreme value and no gap, so there is no outlier to pull the mean away from the middle of the list. When data are spread evenly like this, the mean and the median agree closely; when they differ a lot, look for an outlier.
2. Pie chart. Total families =45+90+36+9=180, so one family is \frac{360}{180}=2°.
| Bicycles | Families | Angle |
|---|---|---|
| 0 | 45 | 90° |
| 1 | 90 | 180° |
| 2 | 36 | 72° |
| 3 | 9 | 18° |
| Total | 180 | 360° |
Check. 90+180+72+18=360 ✓. Mean. \bar x=\frac{0\times45+1\times90+2\times36+3\times9}{180} =\frac{0+90+72+27}{180}=\frac{189}{180}=1.05 bicycles per family. Interpretation. The mean is just over one bicycle per family, while the median and modal class are both "one bicycle" — which describes the typical family better than 1.05 does.
Extra practice
Group B (2 marks)
14. The mean of 8 numbers is 17. Find their sum.
15. In a pie chart of 72 students, how many degrees represent 18 students?
Group C (4 marks)
16. The daily wages of 40 workers are: 300–400: 6, 400–500: 12, 500–600: 14, 600–700: 8. Find the mean wage and the modal class, and say which average best describes the data.
Extra practice — answers
14. 8 \times 17 = 136.
15. \frac{18}{72} \times 360° = 90°.
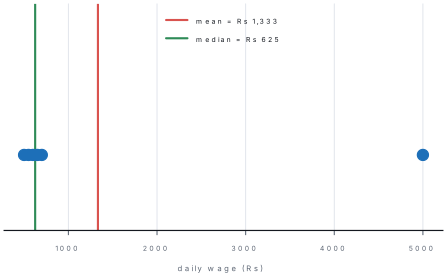
16. Mid-values 350, 450, 550, 650. \sum fx = 6(350) + 12(450) + 14(550) + 8(650) = 2100 + 5400 + 7700 + 5200 = 20400; mean = \frac{20400}{40} = Rs 510. Modal class 500–600 (frequency 14). The mean describes these data well because the wages are evenly spread with no extreme value; had one worker earned Rs 5,000, the median would have been the fairer average.
Objective practice
Choose the correct answer. [5×1=5]
1. The mean of 6, 9, 12, 13 is (a) 9 (b) 10 (c) 10.5 (d) 11
2. The median of 5, 8, 11, 14, 20 is (a) 8 (b) 11 (c) 14 (d) 11.6
3. Which average is most affected by one very large value? (a) mean (b) median (c) mode (d) range
4. In a pie chart of 120 people, 30 people are shown by an angle of (a) 30° (b) 60° (c) 90° (d) 120°
5. The modal class is the class with the (a) largest mid-value (b) highest frequency (c) smallest frequency (d) widest interval
Objective practice — answers
1. (b) — \frac{40}{4}=10.
2. (b) — the middle value.
3. (a) — the mean uses every value.
4. (c) — \frac{30}{120}\times360°=90°.
5. (b) — the highest frequency.
Practise more: Mathematics question bank