Unit 31 · Writing and Skills · 21 min read
Guided Writing: Charts, Graphs and Outlines
What the syllabus asks for 8
- What Question 4 asks, and how the seven marks fall
- Reading the six kinds of visual
- The phrase bank
- Describing a line graph: trends and a crossing point
- Describing a grouped bar chart: comparison within and across
- Describing a process or a flow chart
- Writing a story from an outline
- Marking checklist for Question 4
Question 4 hands you the material and pays seven marks for the sentences you build out of it. In Grade 12 the material is harder than it was a year ago: two lines on one graph instead of one, a grouped bar chart, a table with rows and columns, a flow chart, a process diagram — or a set of outline notes that has to become a story with a shape. Nothing has to be invented, and nothing may be. What is being tested is whether you can turn a picture of information into English that a reader who has never seen the picture could follow.
A Grade 12 data description does three things: it says what the visual shows, it picks out the pattern, and it supports the pattern with figures. It does not explain why the pattern happened, and it does not give an opinion. Every sentence of cause you add is a sentence of description you did not write.
31.1 What Question 4 asks, and how the seven marks fall
The instruction is one of these:
- Study the chart / graph / table given below and write a description of it in about 150 words.
- The flow chart below shows the process of … Describe the process.
- Develop a readable story with the help of the given outlines and give it a suitable title.
| What is credited | Marks | What that means in practice |
|---|---|---|
| Content | 3 | Every key figure quoted; the overall pattern named; nothing invented |
| Organisation | 2 | A paraphrased opening, an overview, grouped details, a close; a title where asked |
| Language | 2 | Range of trend and comparison vocabulary; accurate grammar, articles, tenses |
Length 150–200 words. Time about fifteen minutes. Writing 300 words does not buy a fourth content mark; it only doubles the chances of a language error.
31.2 Reading the six kinds of visual
Before a single word is written, read the title, the axis labels, the units and the key. Most lost content marks begin here: a candidate describes thousands as hundreds, or reads a percentage as a number of people.
| Visual | Shows | Read it by | First thing to find |
|---|---|---|---|
| Bar chart | separate quantities side by side | comparing heights | tallest bar, shortest bar |
| Grouped bar chart | two or more sets compared across the same categories | comparing within a group, then across groups | widest gap, narrowest gap |
| Line graph | change over time | following each line left to right | overall direction; peaks, troughs, crossing points |
| Pie chart | parts of one whole (always 100 %) | comparing slices | biggest slice, smallest slice, anything over half |
| Table | exact figures, two variables at once | reading along a row, then down a column | the extreme value in each row and column |
| Flow chart / process diagram | stages in a fixed order | following the arrows | how many stages; where the process starts and ends |
Three questions answered from the labels give you your first sentence every time: what is measured? in what units? for whom and over what period?
- Copying the title as the first sentence. Paraphrase it. Household expenditure by head, 2081 becomes The chart compares what an average household spent under six headings in 2081.
- Misreading the unit. Rs '000 means thousands of rupees. A bar of height 12 is Rs 12,000, not Rs 12.
- Turning a percentage into a headcount without the total, or the reverse. Do it only when the total is given.
- Describing a two-line graph one line at a time and never comparing them. The comparison is the answer.
- Listing every single figure. Six or seven well-chosen numbers score more than twenty.
- Giving a reason. Enrolment fell because of the pandemic is not in the chart.
31.3 The phrase bank
This is the vocabulary the two language marks are actually awarded for. Learn it in columns, not as a list.
Movement.
| Direction | Verbs | Noun form |
|---|---|---|
| up a little | edged up, picked up, crept up | a slight rise, an upturn |
| up a lot | rose, increased, climbed, grew, surged, shot up, doubled, trebled | a sharp rise, a surge, growth |
| down a little | dipped, eased, slipped | a dip, a slight fall |
| down a lot | fell, dropped, declined, slumped, plunged, halved | a steep fall, a slump, a decline |
| no change | remained steady, held steady, levelled off, plateaued, showed little change | stability, a plateau |
| up and down | fluctuated, varied, rose and fell | fluctuation |
| turning point | peaked at, reached a peak of, bottomed out at, reached a low of, recovered, rebounded | a peak, a trough, a recovery |
How much, how fast. Adverbs follow the verb; adjectives precede the noun.
| Degree | Adverb | Adjective |
|---|---|---|
| a great deal | sharply, steeply, dramatically, markedly | a sharp, steep, dramatic, marked rise |
| evenly | steadily, gradually, consistently | a steady, gradual, consistent fall |
| a little | slightly, marginally, modestly | a slight, marginal, modest increase |
| all at once | suddenly, abruptly | a sudden, abrupt drop |
Comparison and proportion — the half of the phrase bank Grade 11 does not need.
| Job | Expressions |
|---|---|
| more / less | far higher than, marginally lower than, well above, just below, outnumbered |
| multiples | twice as many as, three times more than, half as many as, roughly 1.5 times |
| share of a whole | accounts for, makes up, represents, constitutes; food accounts for a fifth of the total |
| rank | the largest, second only to, followed by, followed closely by, the smallest |
| contrast | whereas, while, by contrast, on the other hand, compared with |
| similarity | roughly the same as, almost identical to, close to, in line with |
| estimating | about, roughly, approximately, just over, just under, nearly, some |
| fractions | a fifth, a quarter, a third, two-fifths, half, three-quarters, one in five |
The prepositions, which carry a language mark of their own:
- rose to 138 (where it ended) · rose by 48 (how much it moved)
- rose from 90 to 138 · a rise of 48
- an increase in the number of students (never ~~increase of the number~~)
- stood at 42 in 2074 · fluctuated between 70 and 85
- over the period · during the last three years · from 2074 to 2081
Dated data in the past takes the past simple: enrolment rose. A chart with no dates, or a process that still happens, takes the present simple: food accounts for, the waste is collected. A projection takes will or is expected to. Choose once and keep it.
31.4 Describing a line graph: trends and a crossing point
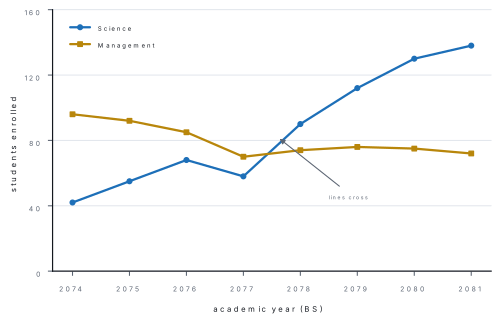
Model answer 31.1 — a line graph with two series
Question. Study the line graph given above and describe it in about 150 words. [7]
Model answer.
The line graph compares the number of students who enrolled in Grade 11 in the Science and Management faculties of one secondary school in Butwal over the eight years from 2074 to 2081 BS.
The overall pattern is a reversal. Science began as much the smaller faculty and ended as much the larger, while Management declined and then plateaued.
In 2074 Science had only 42 students against Management's 96, well under half. Science then grew steadily to 68 by 2076, and both faculties dipped in 2077, Science to 58 and Management to 70. From that point the two lines separated for good. Science rose sharply to 90 in 2078 and climbed every year afterwards, reaching 138 in 2081 — more than three times its opening figure. Management, by contrast, recovered only modestly, fluctuating between 72 and 76 for the last four years.
By the end of the period, then, Science students outnumbered Management students by almost two to one.
Why it scores. The opening paraphrases the title; the second paragraph is a pure overview with no figures in it; the details are grouped by period rather than listed year by year; the crossing point is named; and dipped, rose sharply, climbed, recovered modestly, fluctuated, plateaued replace six uses of increased.
31.5 Describing a grouped bar chart: comparison within and across
With two sets of bars, the answer is built out of gaps, not out of heights. Find the widest gap and the narrowest gap first — those two sentences alone are worth most of the overview mark.
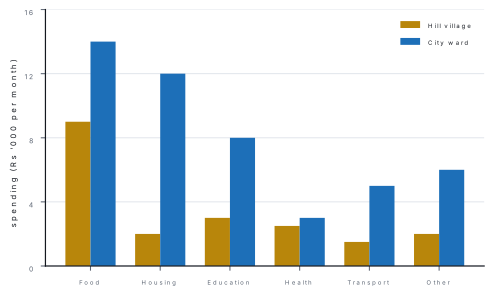
Model answer 31.2 — a grouped bar chart
Question. The bar chart above compares the average monthly expenditure of a household in a hill village and of a household in a city ward. Describe it in about 150 words. [7]
Model answer.
The bar chart sets the average monthly spending of a village household beside that of a city household under six headings, measured in thousands of rupees.
The city household spends more under every single heading, and its total outlay, at about Rs 48,000, is close to two and a half times the village figure of Rs 20,000.
Food is the largest item for both, at Rs 14,000 in the city and Rs 9,000 in the village; but it matters far more in the village, where it accounts for nearly half of all spending, than in the city, where it makes up under a third. The widest gap is housing: Rs 12,000 against Rs 2,000, six times as much. Education and transport show the same pattern on a smaller scale. Health is the one heading on which the two are close, Rs 3,000 against Rs 2,500.
Overall, the city household spends more in total and far less of it on food.
Why it scores. It gives a total as well as items; it converts two bars into a share of the whole (nearly half, under a third), which is the comparison Grade 12 wants; it names the widest and the narrowest gap; and it groups education and transport instead of listing them.
31.6 Describing a process or a flow chart
A process diagram is not data. It has no figures, no trend and no comparison; it has stages in a fixed order, and the language that carries it is different.
- The present simple passive, because who does it does not matter: the waste is weighed, plastic **is picked out, the compost is bagged**.
- Sequencers: first, next, then, at this stage, once the waste has been sorted, after which, meanwhile, finally.
- Purpose and condition: so that, in order to, if any plastic remains, until the pile has cooled.
- An opening that counts the stages: The diagram shows how … in six main stages, beginning with … and ending with … .
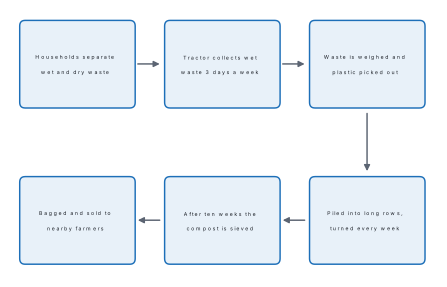
Model answer 31.3 — a process diagram
Question. The flow chart above shows how a municipality makes compost out of household waste. Describe the process in about 150 words. [7]
Model answer.
The flow chart shows how one municipality converts wet household waste into compost for sale, in six main stages that run from the kitchen to the farm.
The process begins in the home, where households are required to keep wet waste separate from dry. This wet waste is collected by tractor three days a week and taken to the municipal yard. On arrival it is weighed, and any plastic that has slipped through the separation at home is picked out by hand, since plastic cannot be composted.
The cleaned waste is then piled into long rows, which are turned over once a week so that air can reach the middle of each pile. Turning continues for about ten weeks, after which the material is sieved to remove stones and pieces that have not broken down.
Finally the finished compost is bagged and sold to farmers in the surrounding villages.
Why it scores. It counts the stages in the first sentence and names the start and the end point; the whole answer is in the present simple passive; every stage has its own sequencer; and two short purpose clauses (so that air can reach…, since plastic cannot be composted) show a reader why a stage exists without inventing anything.
31.7 Writing a story from an outline
The other half of Question 4 gives you notes and asks for a story. At Grade 12 the examiner expects rather more than a chain of sentences beginning Then he.
- Read every note first. You cannot choose an opening until you know the ending.
- Fix what the notes leave out: a name, a district, a season, a time of day. What you invent must not contradict a note.
- Decide tense and person and hold them — simple past, third person, unless the notes say I.
- Weight the notes unequally. The turning point gets four or five sentences; the setting gets two. Giving every note the same space is what makes a story flat.
- Show rather than tell. Not he was frightened but he put the bag down twice before he could untie it.
- One or two lines of direct speech, punctuated correctly, lift the whole answer: "I only returned what was not mine," he said.
- Title and moral last. Three to six words; a title must not give the ending away.
| Outline note | What it must become |
|---|---|
| an old teacher, small village | a name, a place, one detail of how he lives — 2 sentences |
| a letter arrives | who brings it, what it looks like, what he does before opening it — 3 sentences |
| refuses the money | what is said, by both people, in direct speech — 2 sentences |
- Note form left in. Poor farmer goes market, finds bag. Every note must become a full sentence with articles and a finite verb.
- Tense drift. He opened the gate and sees a snake. Choose the past and stay there.
- A borrowed moral. If the notes end in an act of honesty, the moral is about honesty — not unity is strength remembered from another story.
- A title that tells the ending. The Honest Farmer Is Rewarded has given the whole story away before the first line.
31.8 Marking checklist for Question 4
Two minutes at the end. Each line is a real mark.
| Check | Mark at risk | |
|---|---|---|
| 1 | Is the first sentence a paraphrase, not a copy, of the title? | Organisation |
| 2 | Is there a separate overview sentence naming the pattern? | Content |
| 3 | Are six to eight figures quoted, each with its unit? | Content |
| 4 | For two series, have I compared them and not just listed each? | Content |
| 5 | For a process, is it present simple passive with sequencers? | Language |
| 6 | Is every outline note used, in order? | Content |
| 7 | Is there a title, if one was asked for? | Organisation |
| 8 | Prepositions: rise of, increase **in, rose to, rose **by | Language |
| 9 | One tense throughout, apart from direct speech? | Language |
| 10 | Any cause, opinion or outside fact? Delete it. | Content |
| 11 | Between 150 and 200 words? | Organisation |
Chapter summary
- Question 4 is 7 marks: content 3, organisation 2, language 2. Write 150–200 words in about fifteen minutes.
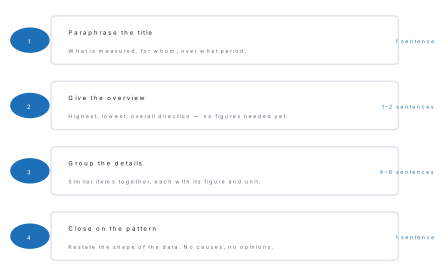
- Four moves: paraphrase the title, give the overview, group the details with figures, close on the pattern.
- Read the title, axes, units and key before writing. Most content errors begin with a misread unit.
- Trend verbs: rose, climbed, surged / fell, slumped, halved / levelled off, plateaued / peaked at, bottomed out at, fluctuated, with sharply, steadily, slightly.
- Comparison is the Grade 12 skill: twice as many as, accounts for a fifth of, marginally lower than, whereas, second only to.
- Prepositions: rose to a value, by an amount, from X to Y; a rise of; an increase in.
- A process diagram takes the present simple passive plus sequencers, and an opening that counts the stages.
- A story from an outline: read all the notes, invent only the frame, simple past, weight the climax most heavily, one line of direct speech, title and moral last.
- Describe; never explain. No causes and no opinions unless the question asks for them.
Practice questions
Guided writing — charts and graphs (7 marks each)
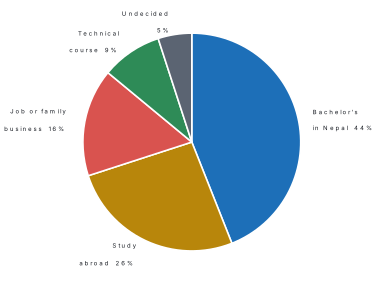
- Study the pie chart given below and describe it in about 150 words. [7]
- The table below shows the pass percentage in four subjects at one higher secondary school over three years. Describe it in about 150 words. [7]
| Subject | 2079 | 2080 | 2081 |
|---|---|---|---|
| English | 71 | 76 | 84 |
| Nepali | 88 | 87 | 89 |
| Mathematics | 54 | 49 | 61 |
| Physics | 66 | 70 | 72 |
Model answers
1. The pie chart shows what five hundred Grade 12 students of one district said they planned to do once the board examination was over, with each answer given as a percentage of the whole group.
Studying on in Nepal was by far the commonest plan. Forty-four per cent, or two hundred and twenty students, intended to take a bachelor's degree here — almost half the group and a larger share than the next two answers put together.
Going abroad to study came second at 26 per cent, that is one hundred and thirty students, so that seven students in ten intended to continue their education in one country or the other. Sixteen per cent, eighty students, expected to take a job or join the family business, and 9 per cent, forty-five students, named a technical or vocational course. Only 5 per cent, twenty-five students in all, were still undecided, much the smallest slice.
Overall, the great majority of the group had already chosen further study. (Notes: percentages turned into headcounts because the total of 500 is given; the two study options grouped; the smallest slice named; no reason invented.)
2. The table compares the pass percentage in four subjects at one higher secondary school in each of the three years from 2079 to 2081 BS.
Nepali was the strongest subject throughout and Mathematics the weakest, and three of the four subjects finished the period higher than they began it.
Nepali held almost steady in the high eighties, moving only from 88 to 89 per cent, and it was the best-performing subject in every year. English improved the most, climbing thirteen points from 71 to 84 per cent, and it ended second only to Nepali. Physics rose more gently, by six points from 66 to 72 per cent. Mathematics was the one subject to fall before it recovered: it slipped five points to 49 per cent in 2080, the lowest figure in the table, before rising to 61 per cent in 2081.
Overall the gap between the best and the weakest subject narrowed from 34 points to 28. (Check the arithmetic: 88 − 54 = 34 in 2079, and 89 − 61 = 28 in 2081.)
Guided writing — a story from an outline (7 marks)
- Develop a readable story with the help of the outlines below and give it a suitable title. [7] A retired schoolteacher in a hill village — walks to the post office every Saturday — a letter from an old student, now a doctor abroad — the student sends money for the school roof — the teacher takes the money to the school committee — refuses to let his own name be written on the wall — the committee writes the student's name instead — the teacher says nothing and goes home — moral.
Model answer
3. The Name on the Wall
For forty-one years Hari Prasad Khanal had taught Nepali at the school above Dhikurpokhari, and for the eleven years since he retired he had walked down to the post office every Saturday whether there was anything for him or not.
On the first Saturday of Mangsir the postmaster handed him a blue envelope with foreign stamps. He did not open it in the office. He carried it home, put on his spectacles, and read it twice. It was from Sabita Gurung, who had sat in the third row in 2049 and was now a doctor in Australia, and it enclosed enough money to put a new roof on the school.
On Monday he laid the draft on the committee table.
"The village should know who gave this," the chairman said. "We will paint your name above the door."
"I only carried the envelope," the old man answered. "Paint the name of the girl who filled it."
They painted Dr Sabita Gurung, 2049 in white letters a foot high. Hari Prasad read it once from the gate, and then walked home without saying anything at all.
A teacher's real work is the name he never puts on the wall.
(Notes: every outline point is used in order; the frame — a name, a village, a month — contradicts nothing; the past simple runs throughout; two lines of direct speech; the climax is given the most space; the title does not give the ending away.)
Short guided-writing skills (1 mark each)
- Rewrite without a cause: Enrolment fell in 2077 because the school closed. [1]
- Correct: There was a sharp increase of the number of visitors. [1]
- Correct: Sales rose by Rs 40,000 in 2080 and rose by Rs 12,000 in 2081. [1]
- Complete with one word: After 2078 the figure stopped rising and ______ at about 80. [1]
- Express as a comparison: Village households spend Rs 2,000 on housing; city households spend Rs 12,000. [1]
- Put into the passive: Workers turn the piles every week. [1]
- Paraphrase this title for a first sentence: Means of transport used by 200 students, 2081. [1]
Answers
4. Enrolment fell in 2077. — A description reports the chart and nothing else; the reason is not in it.
5. …a sharp increase in the number of visitors. — increase takes in before the thing that grows.
6. Sales rose by Rs 40,000 in 2080 and by a further Rs 12,000 in 2081 (or climbed a further Rs 12,000). — repetition of the same verb costs a language mark.
7. plateaued (or levelled off, held steady).
8. City households spend six times as much on housing as village households (or Rs 10,000 more).
9. The piles are turned every week. — present simple passive, as a process description requires.
10. The chart shows how two hundred students travelled to their campus in 2081. — the title's words are replaced, not reordered.
Practise more: English question bank